 Back
Back Home > Advisor View > Reports > Dynamic and PDF Reports > Available Reports > Transaction Reports > Projected Income Report
|
Back |
Home > Advisor View > Reports > Dynamic and PDF Reports > Available Reports > Transaction Reports > Projected Income Report
|
Projected Income Report
|
|
| Applies to: | |||
|---|---|---|---|
| ✔ Dynamic | Mobile |
✔ Client Portal |
|
This report provides data on expected income from dividends, principal repayments, and coupons.
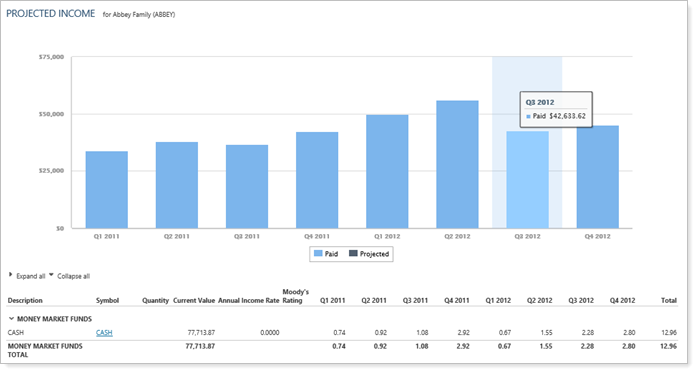
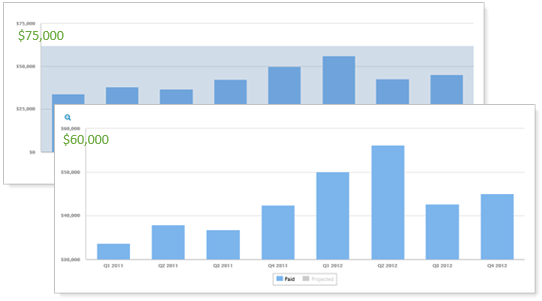
The Projected Income report displays a table and an optional bar chart for a sequential list of periods. The portfolio securities are listed line-by-line in the table along with the actual or expected payment received in each period. Totals are aggregated by category for each period. The bar chart provides a visual representation of the overall paid and projected income for each date period.
Projected income is classified into five categories:
Payments. Income typically received from equity dividends or fixed income coupons. Payments can be projected.
Reinvested Income. Payments that are retained in the investment. Reinvested income is only projected for mutual funds.
Principal Redemptions. The return of an investor’s principal. Principal redemption is projected for fixed income and CDs.
Gain Distributions. Capital gains distributed to mutual fund shareholders from the underlying investment portfolio. Gain distributions are never projected.
Return of Principal. A return of the original capital invested. It is not income. Return of principal will typically occur on mortgage-backed securities. Return of principal is never projected.
You can customize the Managed/Unmanaged labels used for the headings and captions on your reports. These changes can be made on the System Settings page.
In the Projected Income report, you will find versatile sorting and charting options that let you answer many income-related questions about accounts and groups, such as:
How Much Income Will This Account Generate Over the Next 4 Quarters? Evaluate the amount of income generated by each security in accounts or groups over a number of date periods you select.
Unlike many transaction reports where you choose a date period, for this report you choose a starting date and a number of periods you want to project out to. For example you can choose to break it down by month and show 6 months, or by quarters and show only 3 quarters. For more information, see Show Data in X for Y Time Periods.
How Much Income Did a Certain Security Type Generate? See income for all the securities in the account or limit the report to only specific types of securities, such as equities, fixed income, mutual funds, and more.
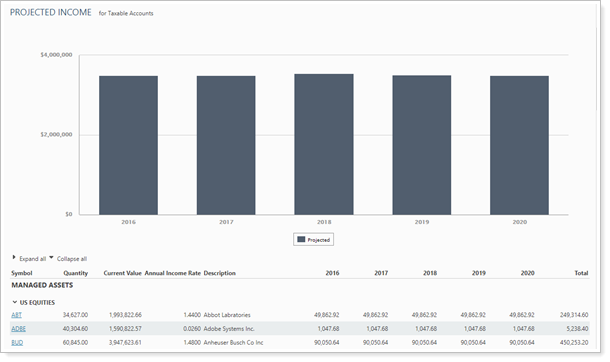
An advisor is financial planning with a client and wants to plan for future incomes and prepare for possible tax implications, depending on the income source.
The advisor uses a Projected Income report to look at the client's taxable accounts for the next five years. The chart provides a broad overview of the income expected to receive, and the table, sorted by equity type, helps the advisor drill into the income source and possible tax repercussions.
The dynamic report helps you easily filter and sort data to drill down to meaningful results. Interactive reporting features include:
Highly customizable. Display only relevant data. You control what data are displayed and which columns are included, in what order, so you can create the exact report you need.
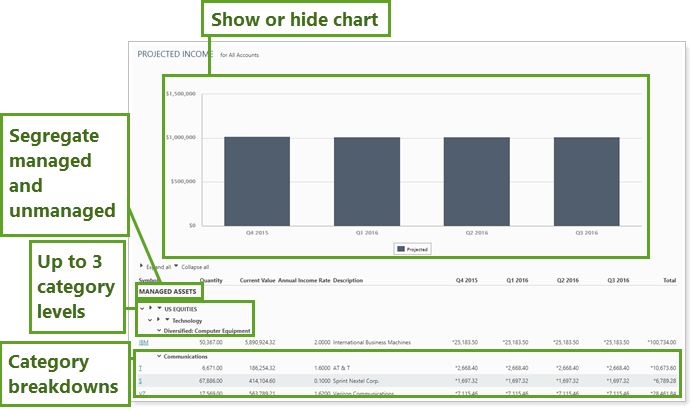
Filtering. Powerful filtering lets you see only relevant data points for the designated securities. Control how much detail you see—anything from all securities or transaction types to just one specific type.
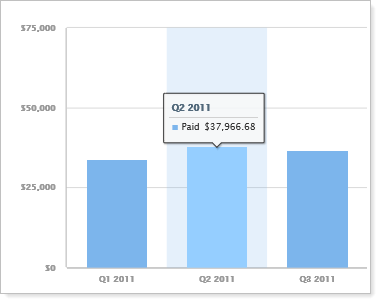
Tooltips. Hover over a bar to see a tooltip and details for that data point.
Customize Data. Click data points in the chart legend to show/hide data points.

Customize zoom.
Zoom in on the allocation over time chart by clicking and dragging to select an area. You can then scroll through the zoomed area by holding down the Shift key and dragging to the left or right. Reset your zoomed chart quickly by clicking the  button.
Customize Report Sections. View a bar chart of income for the date periods selected, or see only the detailed table. For more information, see Show Chart.

Expand/Collapse. Expand (>) or collapse (˅) table rows to further control the level of detail.

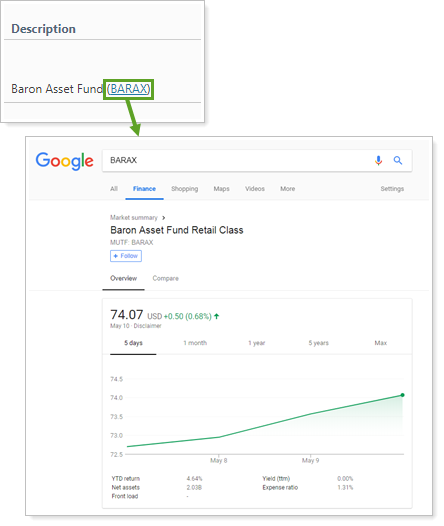
View Security Details. Click the name of a security to view Google Finance information about that security.
You can to enable or disable ticker links for each security type.
Mark Projected or Paid Income. Use the character of your choice to mark paid or projected income for easier differentiation in the table. This is especially useful if the report start date is in the past. It helps you distinguish income already paid with projected income. For more information, see Mark Projected/Paid With.

You can use dashboard views to see a pared-down, at-a-glance summary of the main dynamic report on your dashboard.

To learn more about creating and managing dashboard views, see Create and Share Dashboard Views.
For more information on customizing your dashboard, visit Add/Edit/Delete Dashboard Modules.
The following settings are available for the Projected Income report. Click the setting name for more details:
| Setting | Details | Available In... | |||
|---|---|---|---|---|---|
| Dynamic Report | PDF Report | Advisor Dashboard | PDF Dashboard |
||
| Report Name | Designate a unique name for the report view. | X | X | ||
| Mark as Publicly Accessible | Share the report view. | X | |||
| Section Title | Designate what the section will be called in the PDF report. | X | X | ||
| Theme | Designate what theme the section will use. | X | |||
| Header and Footer | Choose a unique header and footer for the section or use defaults. | X | |||
| Include Page Break After This Section |
Control where page breaks occur in PDF reports. |
X | |||
| Account Grouping | Control grouping of accounts and groups. | X | |||
| From Date | Manually set a start date for the report. | X | X | X | X |
| Show Data in X for Y Time Periods |
Designate the time period for which you want to run the Projected Income report and how many iterations of that period are displayed. NoteOn the Advisor Dashboard, the Time Periods option is not available. |
X | X | X | X |
| Group By/Then By |
Organize a report by various categories. Includes related setting:
NoteOn the PDF Dashboard, this is called Grouping. |
X | X | X | X |
| Sort By | Determine the default order in which the data is displayed. | X | |||
| Unmanaged Asset Treatment |
Choose how you want to treat unmanaged assets. NoteFor more information about marking securities as unmanaged and how reports display unmanaged assets, see How Reports Handle Unmanaged Assets. |
X | X | ||
| Mark Projected With/Mark Paid With | Set how you want to label projected and paid income. | X | X | X | |
| Combine Group Positions | Combine any common positions that are held within a selected group. | X | X | ||
| Report SMAs as a Single Line Item | Choose how you want to see SMAs in the report. | X | X | X | X |
| Report Security Groups as Single Line Item | Choose how you want to see security groups in the report. | X | X | X | X |
| Include the Following Security Types | Designate what securities are included in the report. | X | X | X | X |
| Include the Following Transaction Types | Designate what transactions are included in the report. | X | X | X | X |
| Show Chart | Show or hide a chart summarizing income and expenses. | X | X | ||
| Available/Selected Columns | Choose which columns are included and in what order. | X | X | ||
| Show Table or Bar Chart | Choose whether the PDF Dashboard section displays a table or a bar chart. | X | |||
To learn more about general dynamic reports settings, including how to customize columns, add footers, and more, see:
You can do any of the following actions with the Projected Income report:
| Action | Available in Dynamic Report | Available in PDF Report | |
|---|---|---|---|
| Run Report | Run dynamic report or PDF template. | X | X |
| Edit Report | Edit report view or template. | X | X |
| Copy Report | Copy report view or template. | X | X |
| Delete Report | Delete report view or template. | X | X |
| Share Report | Share report view or template with other firm users. | X | X |
| Export to Excel | Export report data to a CSV file. | X | NA |
| Print Report | Print a dynamic report. | X | X |
| Site Themes | Edit how the dynamic report looks. | X | |
| Learn More About Customizing How PDF Templates Look | Edit how the PDF report looks. | X |
The calculation used for future payments varies by security type. With the exception of CDs, Advisor View will:
Compute the first payment
Optionally compute the second payment, if the first payment is unrepresentative of recurring future payments due to:
Large accrual (such as having a delayed first coupon date)
Ex-dividend exclusion
Optionally compute the last payment, if the last payment is not accrued over a full period
With these three values, Advisor View will use the first and last payment values for the starting and ending payments. All other payments will use the second payment as the recurring payment.
Equity positions that are completely sold between the ex-dividend and next dividend date (for example, it is not a holding on the As of Date) will have no projected payment.
CDs will project the full schedule using the compounding frequency on a payment-by-payment basis. The payment is not added to the principal for interest accrual.
For all securities with a recurring payment frequency less than a year, the annual payment rate must be adjusted according to the number of payments within a year.
Below is a high-level overview of projected payments.
| Security Type | Projected Payments |
|---|---|
|
Equities, Mutual Funds, and User-Defined |
|
| Fixed Income, Mortgage-Backed Securities, and CDs |
|
| Unit Trust and Cash |
|
| T-Bill |
|
Below is a high-level overview of projected Principal Redemption.
| Security Type | Projected Payments |
|---|---|
|
Fixed Income, Mortgage-Backed Securities, and CDs |
|
| T-Bill |
|
Principal Redemption will not use call dates. For fixed income, the pre-refund date will be used if it is specified and the final principal redemption will be adjusted by the pre-refund price.
Short positions will have opposite polarity.

