Contents

Introduction
Welcome to the Advisor View Support & Training Center. Here you will find a wealth of information about Advisor View as well as lessons from Tamarac University. The Support & Training Center is constantly changing to incorporate the latest cutting-edge technology and product information so you can get the right answers quickly and easily in the way you like to work.
The following is a brief overview of the self-help features this site puts at your command:
-
HELP CENTERS. This is a collection of thousands of detailed articles with information about our products and answers to commonly asked questions.
-
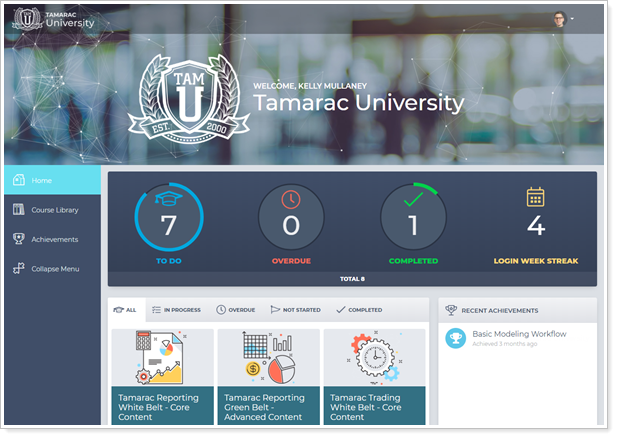
TAMARAC UNIVERSITY. Are you new to Tamarac? Gain a better understanding of how to use Advisor View through our self-paced online training option. This interactive course leads you systematically through the program, from creating financial accounts and groups to running detailed analytical reports. To visit Tamarac University, click Tamarac University at the top of the page.
-
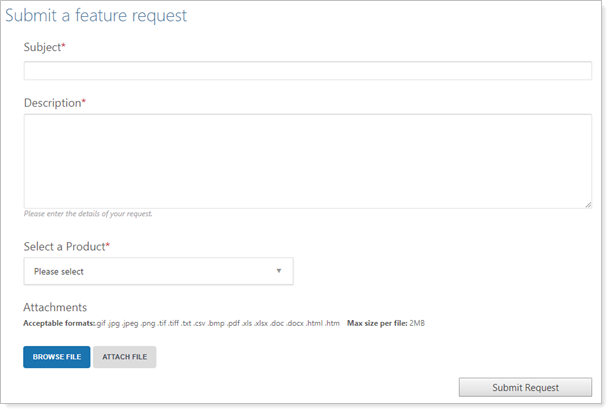
SUGGESTION BOX. Send us product ideas, feature requests and thoughts you want to share about Tamarac products.
-
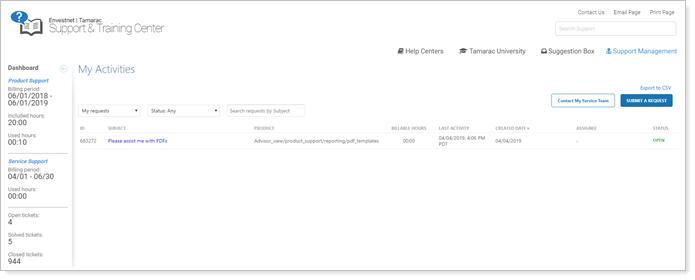
Support Management. We welcome your questions. Send your questions to your dedicated Tamarac service team online. You can also view recent support requests, available/used support hours and other billing information.

Client Portal and Document Vault
You can brand the Advisor View client portal with your company’s logo and give each of your clients secure access from your website, specifying how each client’s portfolio dashboard is presented and the reports and information they can access.
Easily manage your client communications and document exchange with the Advisor View document vault. Post documents and messages to your clients and give them a platform for corresponding and sending documents back to you in a secure and branded interface.
For more information on creating and customizing client portals, visit Learn More About Clients and Client Portals. For more information on working with the document vault, see Introduction to the Document Vault.
Powerful Reports
Advisor View is a dynamic performance reporting application that delivers the information your staff needs in an easy-to-use interface.
View performance across all your accounts in aggregate by advisor, household, or any custom grouping. Design custom PDF reports for internal and client-facing use. Build custom dashboards for staff and give them access to the information they need – all in an elegant, web-based application.
Add custom graphics to your PDF reports and completely customize the look and feel to create meaningful reports that strengthen your firm’s brand. Use the Advisor View automated report generation and delivery functionality to greatly abbreviate your quarter-end reporting process.
There are three primary types of reports in Advisor View:
-
Dynamic Reports. Point-in-time snapshots of portfolio holdings and accounts, as of the previous market close date. These reports are formatted for on-screen viewing and are not ideal for print distribution. You can access the dynamic reports from the Reports menu.
-
PDF Reports. PDF reports are used for internal and client-facing use. You can customize the look of PDF reports to create meaningful reports that strengthen your firm’s brand. These reports are ideal for printing or for quarterly statements. You can access PDF reports from the PDF Templates menu.
-
Bulk Reports. Custom comma-delimited reports that you can build using data found in Advisor View and Advisor Rebalancing.
Advisor View provides several report types and associated initial versions of each. You can build any number of reports for your firm’s internal use, and for sharing out to your clients via the client portal.
| Report Name | Description | Dynamic | |
|---|---|---|---|
| Performance Reports | |||
| Account Analytics |
With the Account Analytics report you can chart risk-adjusted comparisons to benchmarks and indexes for your client portfolios. You can customize the report with relative statistics and portfolio metrics to better manage risk-adjusted returns. Report options include standard deviation, Sharpe ratio, alpha and beta, upside/downside capture, information ratio, and more. |
X | X |
| Account Ledger |
The Account Ledger section provides a tabular view of account performance for all accounts in the report. You can select up to five periods to view. You can also set custom column widths for this report and preview it to determine if the data fits as expected. |
X | |
| Account Performance |
The Account Performance report presents account values. The report includes a line graph for one performance period and a bar graph showing up to 12 return periods. Target benchmarks can be added in both the basic and chart views. You can drill down on the performance for each account to view either underlying holdings or underlying accounts. |
X | X |
| Comparative Review |
This report shows you consolidated totals for your accounts for a particular date range in both IRR and TWR. This report can also show you how the value of your accounts is distributed among your asset classes. You can set custom column widths for this report and preview it to determine if the data fits as expected. |
X | X |
| Interval Performance |
This report is useful for troubleshooting spikes and dips in performance. This report is intended for advisor use only. |
X | X |
| Performance History |
This report compares performance for an account or group with multiple date periods and categories (such as asset classes). For example, you can look in the Net Investment Gain column to see what that value was for each month. Or you could compare the end value for each quarter in order to identify performance patterns. |
X | |
| Position Performance |
The Position Performance report section displays the performance of the portfolio’s individual positions based on selected metrics and groupings. |
X | X |
| Summary |
The Summary section provides a chart view for up to five time periods and table of data that compares the portfolio performance to selected indexes. |
X | X |
| Summary by Category |
The Summary by Category report aggregates performance, holdings, and transactions data to provide details about how an account or group achieved the reported returns at the category level. |
X | X |
| Tax Planning Report |
The tax planning version of the Comparative Review PDF report presents account- and group-level data including long- and short-term capital gains and losses and realized gains and losses, federal and state taxable dividends and interest, and more for a given date period. |
X | |
| Holdings Reports | |||
| Amortization and Accretion |
This new report displays the amount that each fixed income or mortgage-backed security has amortized or accreted over a specified period of time, and provides the necessary year-end fixed income tax reporting. |
X | X |
| Asset Allocation |
The Asset Allocation report presents a pie chart view of an account’s assets with a legend that displays the actual percentages for each group. The chart is interactive. You can choose from four different grouping levels for the display. |
X | X |
| Bond Analysis |
This report includes the option to list all fixed income securities with the yield to maturity and modified duration, at cost and at market value. |
X | X |
| Committed Capital |
If a client has committed capital to a venture capital fund, the client will generally need to make contributions over three to five years to satisfy the terms of the agreement. You can now track the payment information in Advisor View on the new Committed Capital report. |
X | X |
| Holdings |
The Holdings report displays all the holdings in an account, including up to three different grouping levels with subtotals. You can choose which columns to display and their order in the report. You can also set custom column widths for this report and preview it to determine if the data fits as expected. |
X | X |
| Holdings by Account |
The Holdings by Account report allows you to compare an account's asset allocations for a reporting group, and you can view accounts as columns in order to see holdings across multiple accounts. You can choose whether to view values, weight, or both. |
X | |
| Maturity Schedule |
The Maturity Schedule report displays all securities with upcoming maturities for a specified date range. You can choose which types of fixed income will display in the report. If a selected date range will cover multiple maturity periods, Advisor View will group the securities by maturity. |
X | |
| Security Cross-Reference |
The Security Cross-Reference Report lists all accounts that hold one or more securities that you specify (as of the current trade date). |
X | X |
| Unrealized Gains & Losses |
The Unrealized Gains and Losses report is a transactional report that shows all unrealized gain/loss transactions in the account over a specified period. |
X | X |
| Transaction Reports | |||
| Capital Flows |
The Capital Flows report displays all capital flow transactions over a specified time period for the account. You have the option to filter these flows by either a dollar range or percentage of the account value. You can also choose to show an Account Value vs. Net Investment chart for a specified time period. |
X | X |
| Income & Expenses |
The Income and Expenses report provides a consolidated view of income and expenses for your client portfolios. |
X | X |
| Projected Income |
This report provides data on expected income from dividends, principal repayments, and coupons. |
X | X |
| Realized Gains & Losses |
The Realized Gains and Losses report is a transactional report that shows all realized gain/loss transactions in the account over a specified period. |
X | X |
| Recent Trades |
The Recent Trades report provides a summary of all trades that were executed for the time period specified. |
X | |
| Transactions |
The Transactions report displays the transactions for an account over a specified period. You can set custom column widths for this report and preview it to determine if the data fits as expected. |
X | X |
| PDF-Specific Reports | |||
| Custom |
Use the Custom section to add additional custom content for your clients, such as a personal letter, relevant article, envelope insert pages, or cover page. |
X | |
| Dashboard |
The Dashboard report section allows you to present a custom configuration of two, three, or four data sets on a single page. |
X | |
| Table of Contents |
This section adds a table of contents based on the sections you've added to report. The title given to this section will be displayed at the top of the page. |
X | |
| Billing Reports | |||
| Billing |
This section creates a billing statement for the client. |
X | |
| Billing History |
The Billing History report shows the time periods, adjustments, paid amounts, and billing amounts for each portfolio. This report is available as a dynamic report only. |
X | |
| Business Intelligence Reports | |||
| Firm Revenue |
The Revenue report shows the total revenue received by the firm and breaks that down by advisor, to show how much revenue each advisor brought in for a designated time period. |
X | |
| Utilization |
The Utilization report shows Tamarac usage statistics such as number of Households, clients, portal usage, document vault usage, and more. |
X | |
| Compliance ADV Report |
The Compliance ADV report shows general information about your client relationships to help you fill out Form ADV. Examples of this information include the number and value of accounts by client type, custodian, wrap program, and more. |
X | |
| Financial Planning Reports | |||
| Financial Plan Summary |
If you use the MoneyGuide integration, you can see the MoneyGuide Financial Plan Summary as a dynamic report within Tamarac for a quick review of a client's financial plan. |
X | |
| Net Worth |
With the Net Worth report, you can see a client's complete financial picture in one place. The Net Worth report combines assets and liabilities—whether entered manually or via Envestnet | Yodlee integration—with other holdings information to allow you to tell the complete financial story of your clients. |
X | X |
| Relationship Diagram |
The relationship diagram shows how accounts, groups, and Households are connected with each other by displaying connections in a visual tree structure. Learn More >> |
X | |
For more information about the powerful performance reports that Advisor View offers, visit Learn More About Reports.
Flexible, Integrated Billing
Advisor View and Tamarac Services streamline your billing and deliver an array of customizable billing features, so you can bill clients based on their preferences. Handling quarterly billing for your firm, Tamarac Services can bill at various rates, bill in arrears or in advance, exclude certain assets from billing, and apply discounts at the account or household level.
With Advisor View and Tamarac Services, you can take advantage of these powerful billing options:
-
AVERAGE DAILY BALANCE BILLING. Instead of using the beginning or ending market value of a security to determine the rate schedule to apply, Advisor View can use the average daily value of the portfolio to determine the appropriate fee.
-
UNLIMITED RATE TIERS. Create an unlimited number of rate tiers. Fees can be based on the value of the total portfolio, asset classes, sectors, subsectors, or security types.
-
ON-DEMAND BILLING. Run billing statements during the billing cycle to recognize fees for new accounts, closed accounts, or projected revenue.
-
MAKE ADJUSTMENTS AT MULTIPLE LEVELS. Apply discounts at the account, billing definition, or billing group level.
-
ONLINE Billing STATEMENTS. Quickly post personalized billing statements to the client portal for online viewing.
- AND MUCH MORE...
For more information about the powerful billing functionality in Advisor View, visit Learn More About Advisor View Billing.
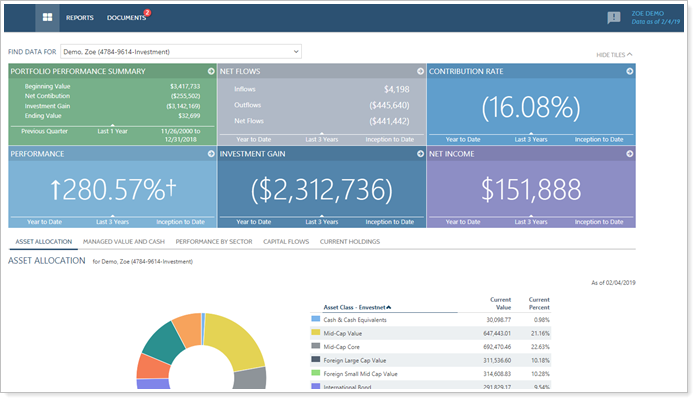
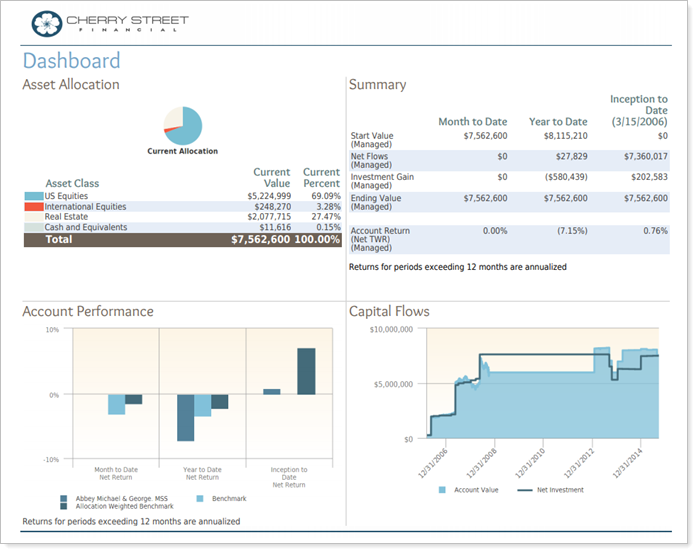
Dashboard
Dashboards aggregate various account data on a single page. You can create dashboards around a single kind of report that applies specifically to your role or around a broad variety of reports so you can monitor several areas at once.
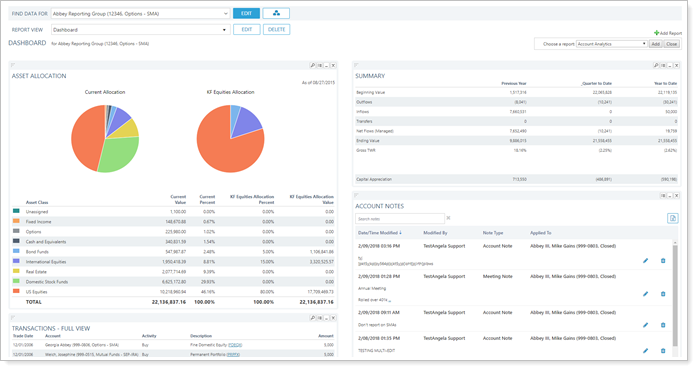
When you create a dashboard, it is visible only in the profile of the user account in which you created it. As of this release, you cannot share dashboard with other users on your firm.
You view and manage your dashboards on the Dashboard page.
You can add a report to a dashboard by clicking Add Report on the Dashboard. For more information on adding reports to the dashboard, visit Working With Dashboard Modules.
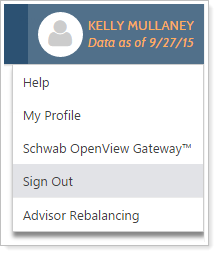
Sign Out
Place your mouse pointer on your name in the upper-right corner, and then click Sign Out when you're ready to end your session.
We encourage you to sign out of Advisor View after each session to protect your client information. Tamarac helps makes your sensitive data more secure by signing users out of Advisor View after a configurable number of minutes of inactivity.
You can also enable dual factor authentication, to reduce the chances of unauthorized use.