 Back
Back Home > Advisor View > Reports > Dynamic and PDF Reports > Available Reports > Transaction Reports > Income and Expenses Report
|
Back |
Home > Advisor View > Reports > Dynamic and PDF Reports > Available Reports > Transaction Reports > Income and Expenses Report
|
Income and Expenses Report
|
|
| Applies to: | |||
|---|---|---|---|
| ✔ Dynamic | Mobile |
✔ Client Portal |
|
The Income and Expenses report provides a consolidated view of income and expenses for your client portfolios at the account, group, and account set level. Income displayed includes dividends, interest, long- and short-term gains, returns of principal, and more.
This report is particularly useful during tax season. It can be used in comparison with a Form 1099 to confirm the amount of taxable income to be reported.

When viewing the dynamic report, click the links on the report to view more information in taxable income.
The Income and Expenses report lists income for the year in which it is taxable. Tamarac uses the portfolio accounting system's data to identify whether income is taxable in the year it is paid or in the previous year.
A dividend was taxable in 2015 but it paid on 1/7/2016. It will be listed on the Income and Expenses report for 2015, not 2016.
In the Income and Expenses report, you will find options that let you answer many income and expense-related questions about accounts and groups, such as:
What taxable income did this account accrue this year? Evaluate the taxable income received by the account or group.
What expenses were charged to this account? See a list of all the different expenses charged to the account or group, or select only specific expense types to see.
As tax season approaches, Advisor Kelly is providing estimated income to clients. Kelly configures the Income and Expenses report to display only taxable income for the previous year and omits expenses entirely. This provides Kelly with a view of the taxable income received.

When it's time to review management fees, Cherry Street Financial uses the Income and Expenses report. It's configured to display only expenses, and expenses are filtered to show only management fees. This provides a thorough accounting of all management fees charged to the group without any extraneous fees or income.

The dynamic report helps you easily filter and sort data to drill down to meaningful results. Interactive reporting features include:
Highly customizable. Display only relevant data. You control what data are displayed and which columns are included, in what order, so you can create the exact report you need.
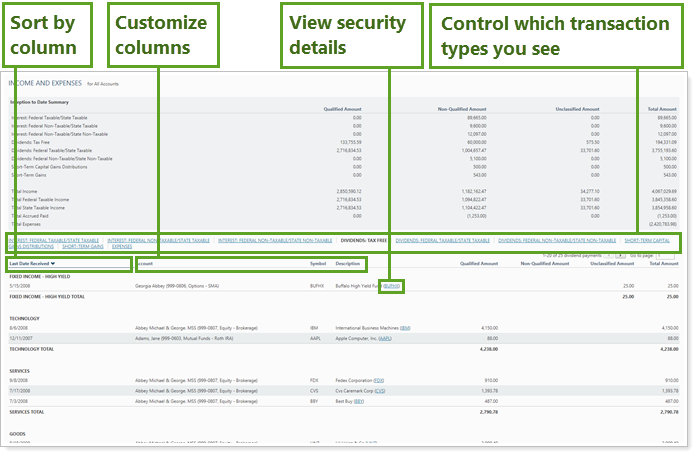
Filtering. Powerful filtering lets you see only relevant transactions. Control how much detail you see of income and expenses, including date received and types.
On-the-Fly Column Sorting. Sort columns by clicking column headers. The caret direction (^ or ˅) indicates sorting order, either ascending or descending.

View Security Details. Click the name of a security to view Google Finance information about that security.
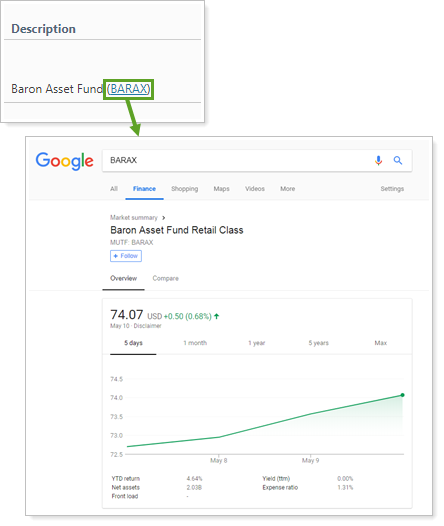
You can to enable or disable ticker links for each security type.
You can use dashboard views to see a pared-down, at-a-glance summary of the main dynamic report on your dashboard.

To learn more about creating and managing dashboard views, see Create and Share Dashboard Views.
For more information on customizing your dashboard, visit Add/Edit/Delete Dashboard Modules.
The following settings are available for the Income and Expenses report. Click the setting name for more details:
| Setting | Details | Available In... | ||
|---|---|---|---|---|
| Dynamic Report | PDF Report | Dashboard Report | ||
| Report Name | Designate a unique name for the report view. | X | X | |
| Mark as Publicly Accessible | Share the report view. | X | ||
| Section Title | Designate what the section will be called in the PDF report. | X | ||
| Theme | Designate what theme the section will use. | X | ||
| Header and Footer | Choose a unique header and footer for the section or use defaults. | X | ||
| Include Page Break After This Section |
Control where page breaks occur in PDF reports. |
X | ||
| Account Grouping | Control grouping of accounts and groups. | X | ||
| Select the date period you want to use for the report. | X | X | X | |
| Group By/Then By |
Organize a report by various categories. Includes related setting:
|
X | X | |
| Payments Per Page | Choose how many payments to display per page. | X | ||
| Include Non-Taxable Accounts | Show or hide non-taxable accounts. | X | X | X |
| Include Income |
Show or hide income data to the report. Includes the following related settings:
|
X | X | X |
| Include Expenses |
Show or hide expense data to the report. Includes the following related settings:
|
X | X | X |
To learn more about general dynamic reports settings, including how to customize columns, add footers, and more, see:
You can do any of the following actions with the Income and Expenses report:
| Action | Available in Dynamic Report | Available in PDF Report | |
|---|---|---|---|
| Run Report | Run dynamic report or PDF template. | X | X |
| Edit Report | Edit report view or template. | X | X |
| Copy Report | Copy report view or template. | X | X |
| Delete Report | Delete report view or template. | X | X |
| Share Report | Share report view or template with other firm users. | X | X |
| Export to Excel | Export report data to a CSV file. | X | NA |
| Print Report | Print a dynamic report. | X | X |
| Site Themes | Edit how the dynamic report looks. | X | |
| Learn More About Customizing How PDF Templates Look | Edit how the PDF report looks. | X |

