
Contents
|
|

Introduction
| Applies to: | |||
|---|---|---|---|
| ✔ Dynamic | Mobile |
✔ Client Portal |
|
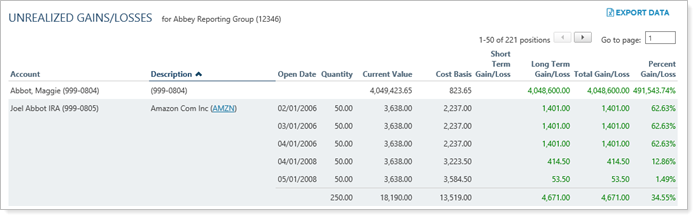
The Unrealized Gains and Losses report is a holdings report. It shows all open trade lots in the account, as well as the gain or loss that would be incurred if the lot was sold on the As of Date for the report—the unrealized gain or loss. Instead of showing returns based on flows, like many reports, the Unrealized Gains and Losses report shows pure market value or capital appreciation.
This report is useful for reviewing the possible tax implications of selling a specific lot of a security.

Why Use the Unrealized Gains and Losses Report?
In the Unrealized Gains and Losses report, you will find versatile sorting and charting options that let you answer holdings-related questions about accounts and groups, such as:
-
What would be the impact of selling this security? Add columns to see long-term, short-term, total, and percent gain/loss to see the potential tax ramifications of selling the security.
-
How has the Market Value of the security Changed? Get access to such data as open date, quantity (of shares), current value, cost basis, and more to give you the knowledge you need to make informed choices for your clients.
-
What is the capital appreciation of a security? See the gain/loss for securities based entirely on market gains or losses, excluding the impact of flows.
Example 1
A client calls up Advisor Kelly and asks Kelly to raise $750,000 for the client's new vacation home. Kelly uses the Unrealized Gains and Losses report sorted to display short- and long-term gains and losses to look at the client's brokerage account. This helps Kelly identify which tax lots to sell to minimize the tax impact.
Features of the Unrealized Gains and Losses Report
The dynamic report helps you easily filter and sort data to drill down to meaningful results. Interactive reporting features include:
-
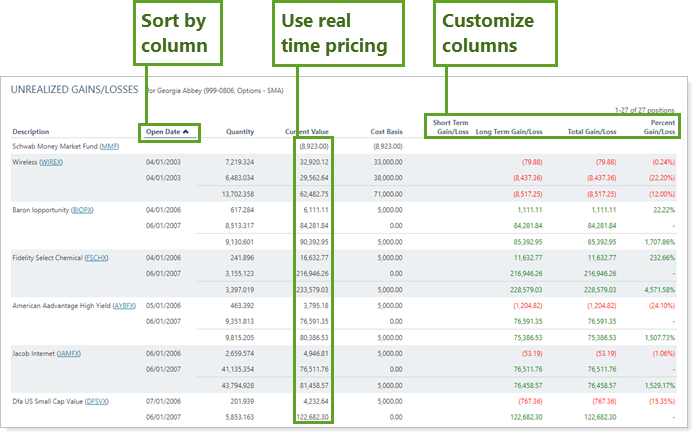
Highly customizable. Display only relevant data. You control what data are displayed and which columns are included, in what order, so you can create the exact report you need.
-
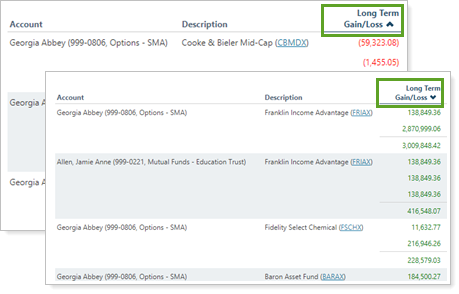
On-the-Fly Column Sorting. Sort columns by clicking column headers. The caret direction (^ or ˅) indicates sorting order, either ascending or descending.
-
View Security Details. Click the name of a security to view Google Finance information about that security.
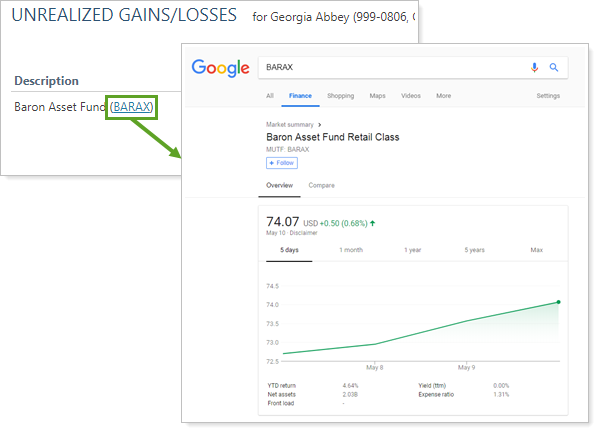
Note
You can to enable or disable ticker links for each security type.
-
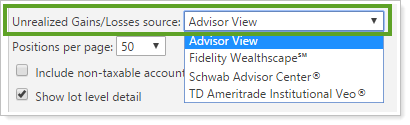
Set the Data Source. You can choose the data source: Either the custodian or Advisor View. If you choose Advisor View, the data could come from your portfolio accounting system, or from the custodian if Use the account custodian as the source of record for the Realized Gains/Losses report is selected. To learn more about setting the data source, see Data Source.
Add Unrealized Gains and Losses to the Advisor Dashboard
You can use dashboard views to see a pared-down, at-a-glance summary of the main dynamic report on your dashboard.
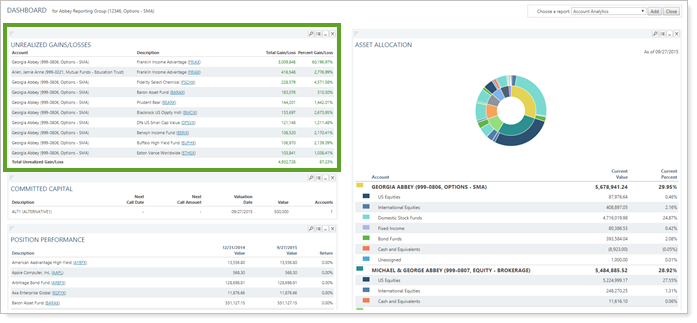
To learn more about creating and managing dashboard views, see Create and Share Dashboard Views.
For more information on customizing your dashboard, visit Add/Edit/Delete Dashboard Modules.
Unrealized Gains and Losses Report Settings
The following settings are available for the Unrealized Gains and Losses report. Click the setting name for more details:
| Setting | Details | Available In... | |||
|---|---|---|---|---|---|
| Dynamic Report | PDF Report | Advisor Dashboard | PDF Dashboard | ||
| Report Name | Designate a unique name for the report view. | X | X | ||
| Mark as Publicly Accessible | Share the report view. | X | |||
| Section Title | Designate what the section will be called in the PDF report. | X | X | ||
| Theme | Designate what theme the section will use. | X | |||
| Header and Footer | Choose a unique header and footer for the section or use defaults. | X | |||
| Include Page Break After This Section |
Control where page breaks occur in PDF reports. |
X | |||
| Account Grouping | Control grouping of accounts and groups. | X | |||
| Positions Per Page | Choose how many accounts, positions, payments, or transactions to display per page. | X | |||
| Include Non-Taxable Accounts | Show or hide non-taxable accounts. | X | X | X | X |
| Combine Group Positions | Combine any common positions that are held within a selected group. | X | X | ||
| Show Lot Level Detail | View detailed information about the holdings at the trade lot level. | X | X | ||
| Report SMAs as a Single Line Item | Choose how you want to see SMAs in the report. | X | X | X | X |
| Available/Selected Columns | Choose which columns, rows, indices, or benchmarks are included and in what order. | X | X | X | X |
To learn more about general dynamic reports settings, including how to customize columns, add footers, and more, see:
Report Actions
You can do any of the following actions with the Unrealized Gains and Losses report:
| Action | Available in Dynamic Report | Available in PDF Report | |
|---|---|---|---|
| Run Report | Run dynamic report or PDF template. | X | X |
| Edit Report | Edit report view or template. | X | X |
| Copy Report | Copy report view or template. | X | X |
| Delete Report | Delete report view or template. | X | X |
| Share Report | Share report view or template with other firm users. | X | X |
| Export to Excel | Export report data to a CSV file. | X | |
| Print Report | Print a dynamic report. | X | X |
| Site Themes | Edit how the dynamic report looks. | X | |
| Learn More About Customizing How PDF Templates Look | Edit how the PDF report looks. | X |