
Contents
|
|

Introduction
| Applies to: | |||
|---|---|---|---|
| ✔ Dynamic | Mobile |
✔ Client Portal |
|
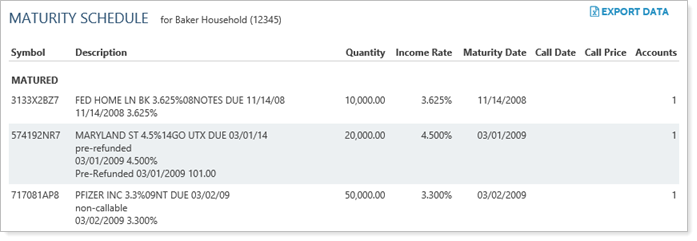
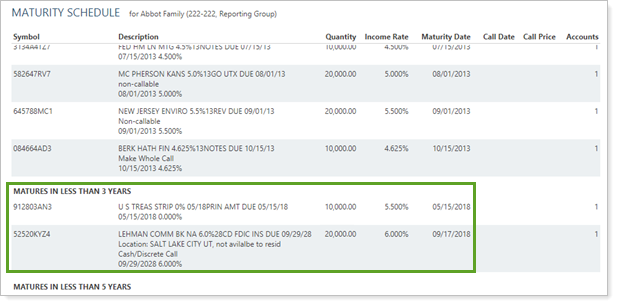
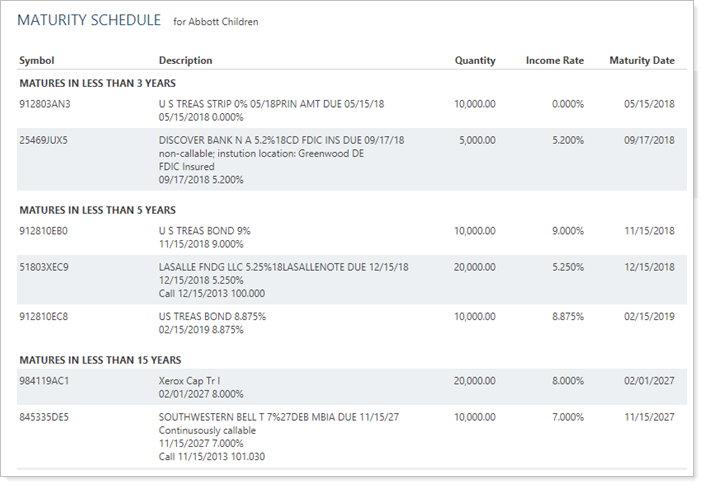
The Maturity Schedule report displays a table listing of the fixed income securities in an account or group, sorted by maturity date within a specified date range. The report allows you to choose which types of fixed income securities are displayed. If a selected date range will cover multiple maturity periods, Advisor View will group the securities by maturity.
The Maturity Schedule report is a powerful tool for monitoring when securities mature within a portfolio and managing accordingly.

Why Use the Maturity Schedule Report?
In the Maturity Schedule report, you will find options that let you answer maturity-related questions about accounts and groups, such as:
-
When are securities maturing in this account? See a list of all the fixed income securities in the account organized by maturity date. You can choose what time period you want to see maturities for, ranging from 0 days to 25 years to any date.
-
Do I need to prepare for many securities maturing at once? Quickly see which securities are maturing at the same time, as well as the broad spread of maturity dates throughout the portfolio.
-
When Will My Client Get Principal Back in this Account? Review maturity dates to prepare for added principal and lost income.
Example 1
An advisor has a new client is retired and is living on the income generated by his bond portfolio. When the client's assets transfer, the advisor carefully evaluates the client's bond portfolio to ensure that income remains steady. The advisor notices that a couple of substantial securities are maturing at the same time. This allows the advisor to begin planning recommended trades.
Features of the Maturity Schedule Report
The dynamic report helps you easily obtain meaningful results. Reporting features include:
-
Sorted by Maturity Date. This report offers set columns and sorting. By default, the report displays securities sorted by maturity date, starting with matured and then in order from maturing soonest to latest.
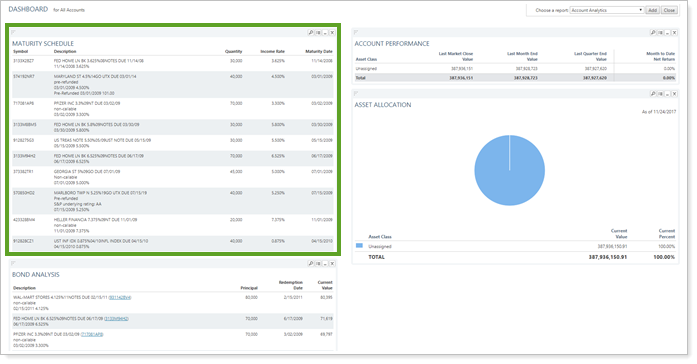
Add Maturity Schedule to the Advisor Dashboard
You can use dashboard views to see a pared-down, at-a-glance summary of the main dynamic report on your dashboard.
To learn more about creating and managing dashboard views, see Create and Share Dashboard Views.
For more information on customizing your dashboard, visit Add/Edit/Delete Dashboard Modules.
Maturity Schedule Report Settings
The following settings are available for the Maturity Schedule report. Click the setting name for more details:
| Setting | Details | Available In... | |
|---|---|---|---|
| Dynamic Report | Advisor Dashboard | ||
| Report Name | Designate a unique name for the report view. | X | |
| Mark as Publicly Accessible | Share the report view. | X | |
| Show Maturities Within the Next [Date Range] | Designate a date range for the report. | X | X |
| Use Next Call Date | Sort the report by the next call date. | X | X |
| Include the Following Security Types | Designate what securities are included in the report. | X | X |
To learn more about general dynamic reports settings, including how to customize columns, add footers, and more, see:
Report Actions
You can do any of the following actions with the Maturity Schedule report:
| Action | Available in Dynamic Report | Available in PDF Report | |
|---|---|---|---|
| Run Report | Run dynamic report or PDF template. | X | NA |
| Edit Report | Edit report view or template. | X | NA |
| Copy Report | Copy report view or template. | X | NA |
| Delete Report | Delete report view or template. | X | NA |
| Share Report | Share report view or template with other firm users. | X | NA |
| Export to Excel | Export report data to a CSV file. | X | NA |
| Print Report | Print a dynamic report. | X | NA |
| Site Themes | Edit how the dynamic report looks. | X | NA |