 Back
Back Home > Advisor View > Reports > Dynamic and PDF Reports > Available Reports > Holdings Reports > Asset Allocation Report
|
Back |
Home > Advisor View > Reports > Dynamic and PDF Reports > Available Reports > Holdings Reports > Asset Allocation Report
|
Asset Allocation Report
|
|
| Applies to: | |||
|---|---|---|---|
| ✔ Dynamic | ✔ Mobile |
✔ Client Portal |
|
The Asset Allocation report offers tailored views that provide a clear picture of a portfolio's makeup. This report allows you to see holdings displayed in a table, pie chart, bar chart, or as allocation over time. Each charting option allows you to tell a different story about the holdings in the account or group.
The Asset Allocation report offers the following charting options:
Table: The table is a basic snapshot showing the allocation in the account or group at a single point in time. It is useful if you want to see a clean, simple list of holdings grouped however you choose.
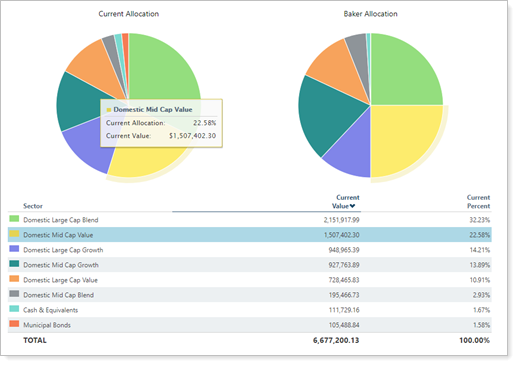
Pie chart: The pie chart shows a snapshot of the allocation with an emphasis on the percentages of each holding. It provides an at-a-glance visual breakdown of the holdings within the account or group.

Bar chart: The bar chart is a snapshot showing the allocation in the account or group at a single point in time. It emphasizes amount of holdings in each account or group. This is useful when comparing current allocation with target allocation.

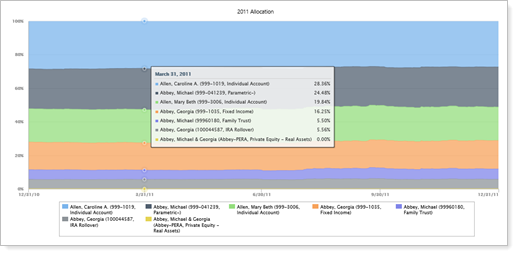
Allocation over time: The allocation over time chart shows strategy change over the selected date period. This is useful when used in conjunction with other reports, such as the Account Performance report, which can together show when allocation changed—perhaps after a rebalance—and the impact that change had on performance.
In PDF reports, this chart is sampled at the following rates:
| When Plotting This Many Years | Data Sampling Frequency |
|---|---|
| 0 to 10 years | Every 1 day |
| 10 to 20 years | Every 7 days |
| 20+ years | Every 30 days |
In the Asset Allocation report, you will find versatile sorting and charting options that let you answer many allocation-related questions about accounts and groups, such as:
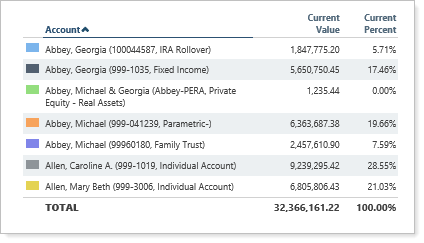
How is this account currently invested? Evaluate the holdings in accounts or groups by category type, such as asset class or security type.
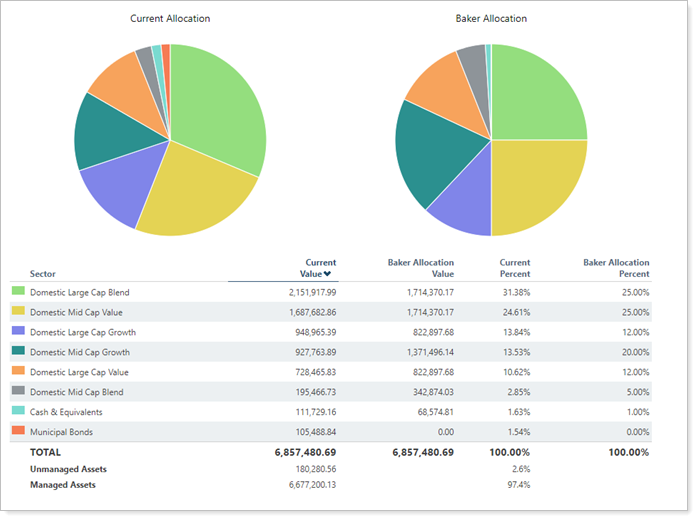
How do this account's current holdings compare with the target allocation? Compare current allocation with assigned target allocation in side-by-side charts and data points.
How has the account's allocation changed over time? Review the change in holdings over a selected date range, with dynamic reporting options that let you flexibly adjust the date range on the fly.
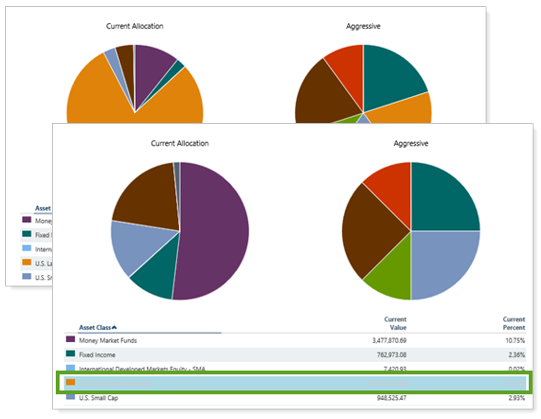
An advisor just brought a new client on board. He discussed with the client an aggressive portfolio comprising primarily US equities, with some international equities and a small number of bonds for stability. When the assets transferred, the advisor assigned a target allocation to the new account reflecting the desired allocation. Now, the advisor wants to evaluate the current holdings and compare them with the intended target allocation.
The advisor uses a basic Asset Allocation report to compare the current allocation in comparison with the target allocation, using a donut chart for quick visual evaluation and a table to provide details.
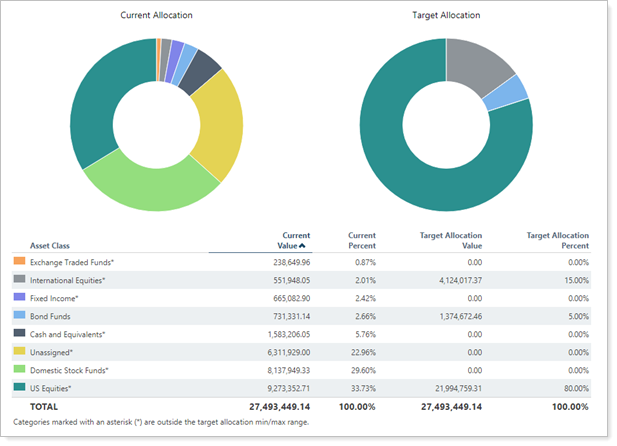
This gives the advisor a good view of how he needs to rebalance the account.
A couple of years ago, an advisor and client discussed rebalancing the client's portfolio. The client asked to put more emphasis on options and the advisor rebalanced accordingly. Now, the client is concerned about the volatility in his account, and he wants to understand why the returns have changed recently.
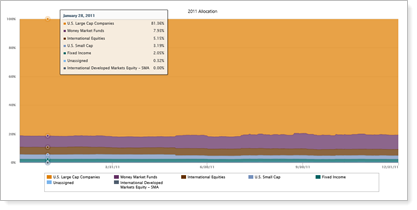
The advisor uses an allocation over time Asset Allocation report to review the allocation changes over the last several years.

This clearly shows a point when options holdings were expanded. In conjunction with the appropriate performance report, the advisor can correlate the change and explain to the client the impact of the rebalance on his account performance.
The dynamic report helps you easily identify and focus on the data that you want to see. Interactive features include:
Tooltips. Hover over a category on the pie or bar chart to see details. You will see a tooltip and the matching category will be highlighted wherever it appears in the chart or table.
For the allocation over time chart, you'll see a tooltip with details for each data type for that day.
Customize Data. Click data points in the chart legend to show/hide data points. This feature is available for pie charts and the allocation over time chart.
Customize zoom. Zoom in on the allocation over time chart by clicking and dragging to select an area. You can then scroll through the zoomed area by holding down the Shift key and dragging to the left or right. Reset your zoomed chart quickly by clicking the  button.

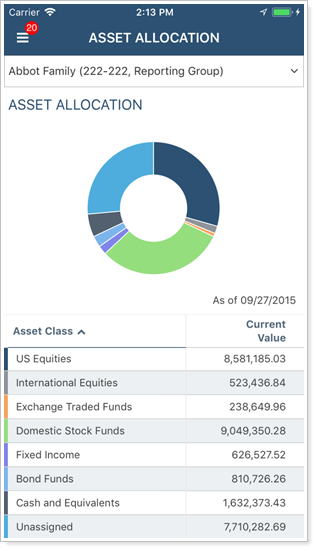
Mobile-friendly. The report is optimized for mobile viewing, making it easy to use on any device, anywhere. To learn more about mobile app report features, see Mobile App Reports.
You can use dashboard views to see a pared-down, at-a-glance summary of the main dynamic report on your dashboard.
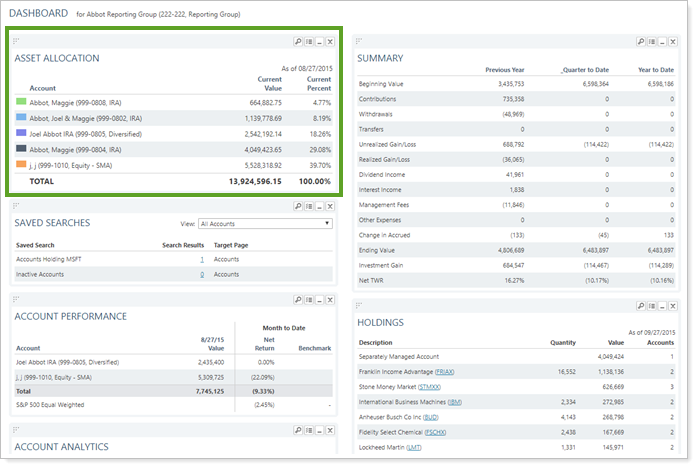
To learn more about creating and managing dashboard views, see Create and Share Dashboard Views.
For more information on customizing your dashboard, visit Add/Edit/Delete Dashboard Modules.
The following settings are available for the Asset Allocation report. Click the setting name for more details:
| Setting | Details | Available In... | |||
|---|---|---|---|---|---|
| Dynamic Report | PDF Report | Advisor Dashboard | PDF Dashboard |
||
| Report Name | Designate a unique name for the view of the report view. | X | X | ||
| Section Title | Designate what the section will be called in the PDF report. | X | X | ||
| Section Alignment |
Align the PDF Dashboard report to the top, middle, or bottom of the vertical space. |
X (table, bar, and pie chart only) | |||
| Theme | Designate what theme the section will use. | X | |||
| Header and Footer | Choose a unique header and footer for the section or use defaults. | X | |||
| Include Page Break After This Section |
Control where page breaks occur in PDF reports. |
X | |||
| Account Grouping | Control grouping of accounts and groups. | X | |||
| Mark as Publicly Accessible | Share the report view. | X | |||
|
Decide what type of table or chart is shown and control related settings. Includes related settings:
|
X | X | X | X | |
| Show Pie Chart Titles | On the PDF Dashboard, show or hide titles for pie charts. | X | |||
| Include Current Allocation in Chart/Include Target Allocation in Chart |
On the PDF Dashboard, choose which allocation charts to display, and how to label them. Includes related settings:
|
X | |||
| As of Date | Select the date you want to use for the report. | X | X | ||
|
Date Period (Allocation Over Time only) |
Select the date period you want to use for the report. | X | X | ||
| Filter By | Filter the assets displayed by category. | X | X | X | X |
|
Compare the current asset allocation side-by-side with a target allocation. Includes related settings:
|
X | X | X | X | |
| Group By/Then By |
Organize a report by various categories. Includes related settings:
|
X | X | X | |
| Maximum Groups to Show | Designate how many different security groups you want displayed. | X | X | ||
| Sort By | Determine the default order in which the data is displayed. | X | X | X | X |
| Include Unmanaged Assets |
Specify how unmanaged assets are treated in the report. NoteFor more information about marking securities as unmanaged and how reports display unmanaged assets, see How Reports Handle Unmanaged Assets. |
X | X | X | |
| Use Multiple Security Categories | Choose whether to display securities by primary category or by multiple categories where applicable. | X | X | X | X |
| Use SMA Categories | Choose how to use the SMA categories assigned to that account. | X | X | X | X |
| Use Security Group Categories | View security categories at the group level. | X | X | X | X |
| Available/Selected Columns | Choose which columns are included, in what order. | X | X | X | X |
| Preview | See a sample of the PDF report with the selected settings. | X | |||
To learn more about general dynamic reports settings, including how to customize columns, add footers, and more, see:
You can do any of the following actions with the Asset Allocation report.
| Action | Available in Dynamic Report | Available in PDF Report | |
|---|---|---|---|
| Run Report | Run dynamic report or PDF template. | X | X |
| Edit Report | Edit report view or template. | X | X |
| Copy Report | Copy report view or template. | X | X |
| Delete Report | Delete report view or template. | X | X |
| Share Report | Share report view with other firm users. | X | X |
| Export to Excel | Export report data to a CSV file. | X | X |
| Print Report | Print a dynamic report. | X | X |
| Site Themes | Edit how the dynamic report looks. | X | |
| Learn More About Customizing How PDF Templates Look | Edit how the PDF report looks. | X |

