
Contents
|
|

How Show As Table/Pie Chart/Bar Chart/Allocation Over Time Works
| Applies to: | ||
|---|---|---|
| ✔ Dynamic |
✔ Client Portal |
|
Many of our reports offer a variety of ways to visually display the data. One option you'll see on several reports is the ability to see the data as a variety of different charts types. This setting allows you decide what type of table or chart is shown. Each option helps you tell a different story.
Click the chart type listed to jump to details.
| Chart Type | Why Choose This Type |
|---|---|
| Moment-in-time snapshot good for simply reviewing holdings. | |
| At-a-glance visual breakdown of the moment-in-time holdings within the account or group. Includes a summary table. | |
|
Moment-in-time snapshot emphasizes amount of holdings in each grouping. This is an especially useful chart when comparing current allocation to target allocation. |
|
|
Useful when used in conjunction with other reports, such as Account Performance report, which can together show when allocation changed and the impact that change had on performance. |

In Dynamic Reports
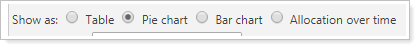
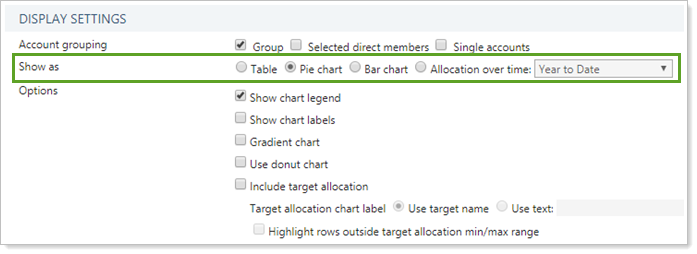
You can choose any of the following:
-
Table
-
Pie chart
-
Bar chart
-
Allocation over Time
Show as Table
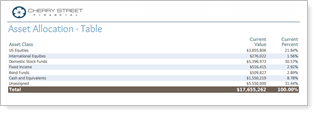
Story it tells: The table is a simple, basic snapshot showing the allocation in the account or group at a single point in time. It is useful if you want to see a clean, simple list of holdings grouped in a variety of ways.
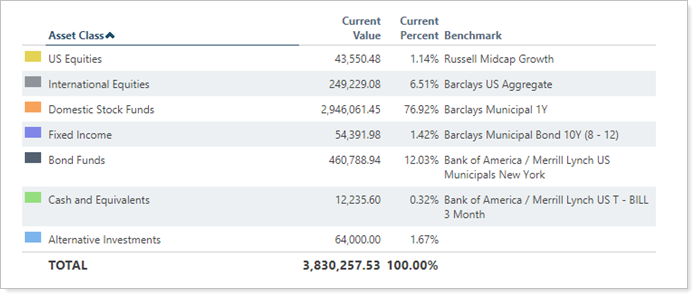
When Include target allocation is selected, you will see the target allocation amounts displayed next to the current allocation.

Data are based on As of Date.
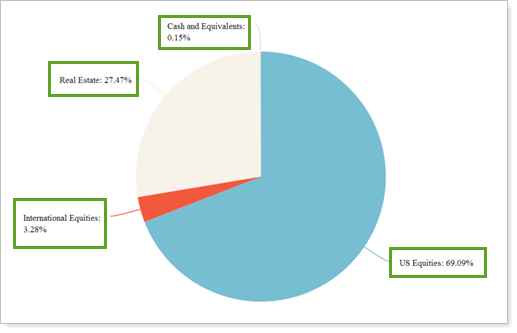
Show as Pie Chart or Donut Chart
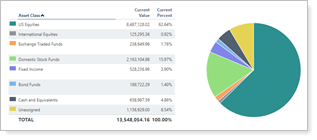
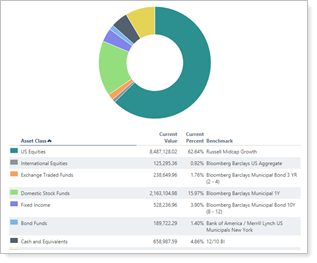
Story it tells: The pie chart shows a snapshot of allocation with an emphasis on what percentage of the whole each holding comprises. It provides an at-a-glance visual breakdown of the holdings within the account or group. You can use this to evaluate the account or group independently or side-by-side with a target allocation.
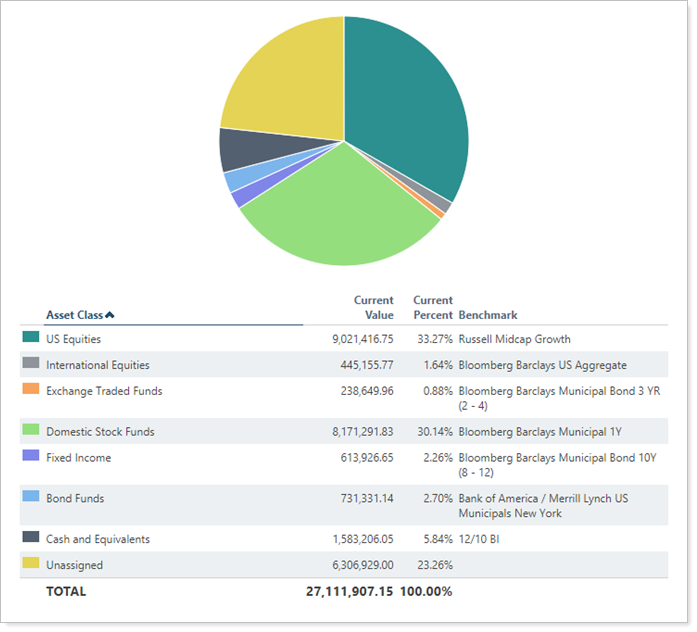
-
When Include target allocation is selected, you will see the target allocation displayed next to the current allocation.
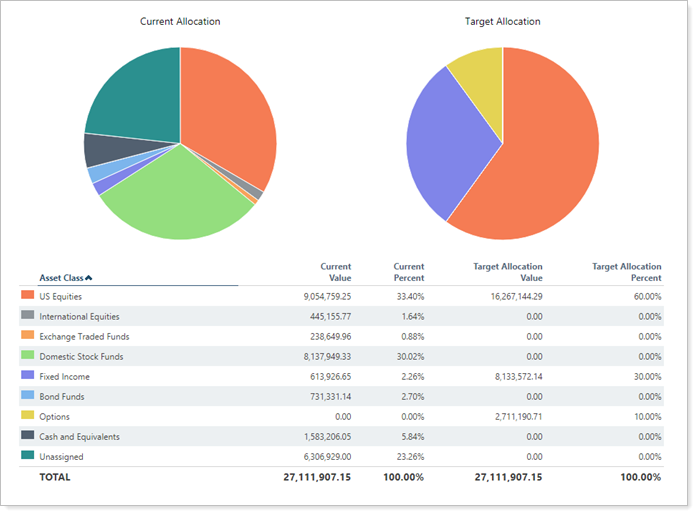
-
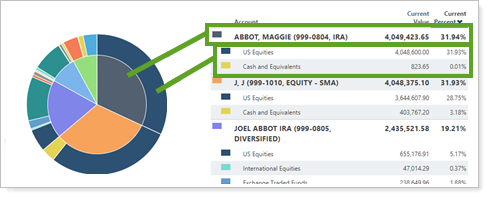
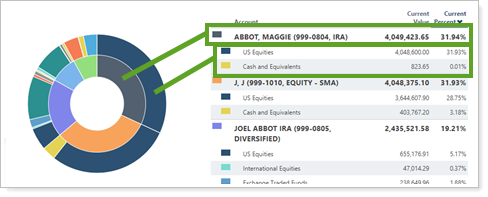
When you Group by/then by, the donut chart includes both grouping levels. For example, if you group by Account and then by Asset Class, the donut chart displays accounts on the inside and asset classes in each account on the outside.
Data are based on As of Date.
When you set Show as to Pie chart, the following settings appear:
Chart Position
This setting determines where the chart is shown in relation to the accompanying table.
| Position | Output |
|---|---|
| Top |
|
| Left |
|
| Right |
|


Use Donut Charts
This setting changes the look of the chart from a traditional pie chart to a donut chart.
When you Group by/then by, the donut chart includes both grouping levels. For example, if you group by Account and then by Asset Class, the donut chart displays accounts on the inside and asset classes in each account on the outside.
Show as Bar Chart
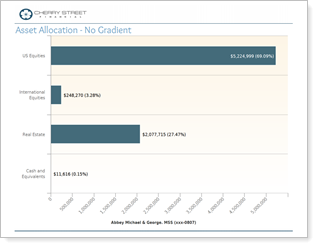
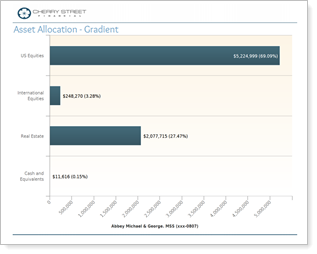
Story it tells: The bar chart is a snapshot showing the allocation in the account or group at a single point in time. It emphasizes amount of holdings in each grouping. This is an especially useful chart when comparing current allocation to target allocation.

-
When Include target allocation is selected, you will see the target value marked with error bars indicating the target maximum and minimum.

Data are based on As of Date.
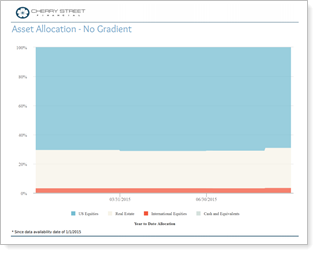
Show as Allocation Over Time
Story it tells: The allocation over time chart shows strategy change over the selected date period. This is an especially useful chart when used in conjunction with other reports, such as Account Performance report, which can together show when allocation changed—perhaps after a rebalance—and the impact that change had on performance.

Data are based on Date Period. The category order is determined by the order you set up in Categories.
In PDF Reports
All four of the chart options are available in PDF reports.
On the PDF report, the following additional chart settings are available:
Allocation over Time (Date Period)
Since the PDF report is run based on the date you select, when you choose to display the Allocation over Time chart, you also designate the date range to display.
Note
PDF reports use the as-of date to determine when to end the "to Date" period. For example, if you run a quarterly report with an as-of date for 3/31/2015, the Year to Date period will run from 12/31/2014 to 3/31/2015.

Date ranges are determined by the firm's Date Periods.
Show Chart Legend
If you selected Pie Chart, this option allows you to add a legend and summary table for the pie chart. If you did not select the Pie Chart option, this check box will be grayed out.
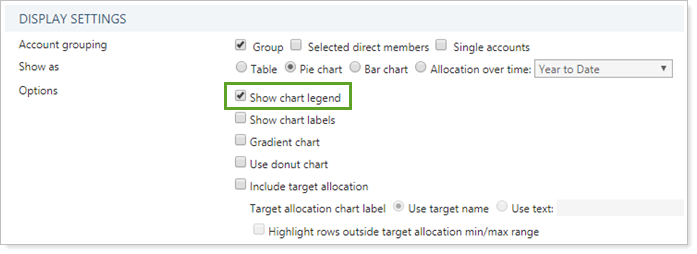
-
To hide the chart legend and summary table, clear the Show chart legend check box.
-
To see the chart legend and summary table, select the Show chart legend check box.

Show Chart Labels
If you selected Pie Chart, this option allows you to use labels for the pie chart. If you did not select the Pie Chart option, this check box will be grayed out.

-
To hide the chart labels, clear the Show chart label check box.
-
To see the chart labels, select the Show chart label check box.
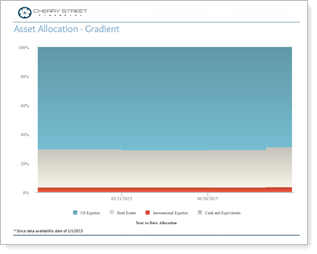
Gradient Chart
In PDF reports, you have the option to add a gradient to the chart. The look of each chart depends on the PDF template theme.
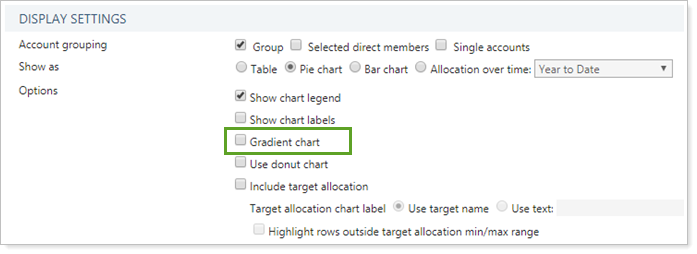
-
To display charts with standard formatting, clear the Gradient chart check box.
-
To display charts with a gradient, select the Gradient chart check box.
| Type | Gradient Chart Cleared | Gradient Chart Selected |
|---|---|---|
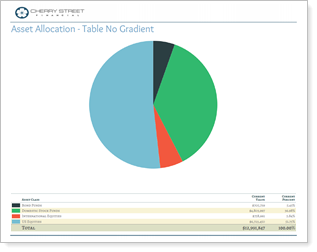
| Table |
|
No change. |
| Pie |
|
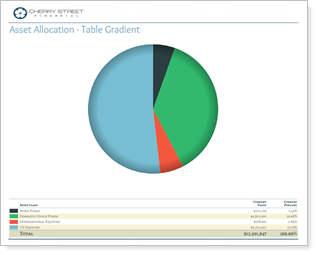
|
| Bar |
|
|
| Allocation over Time |
|
|
Show Category Color Keys
On the PDF Dashboard Asset Allocation section, if you choose to Show pie chart legend, you can choose to use the legend as a color key for the pie chart also.
If you did not select the Show pie chart legend option, this check box will be grayed out.
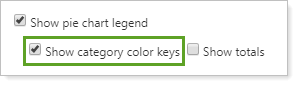
-
To show the color key on the chart legend, select the Show category color keys chart.
-
To hide the color key on the chart legend, clear the Show category color keys chart.
| Setting | More Information |
|---|---|
| Show category color keys selected |
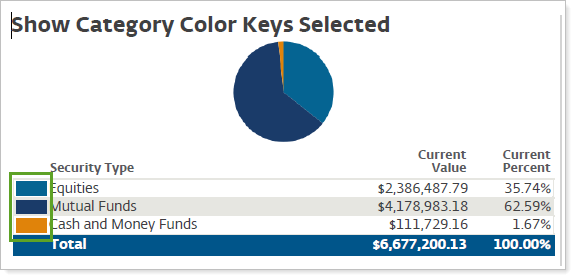
A color key is included in each row to indicate which colors in the pie chart correspond with which categories. |
| Show category color keys cleared |
No color key is shown. |
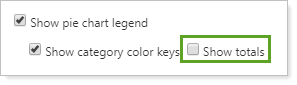
Show Totals
On the PDF Dashboard Asset Allocation section, if you choose to Show pie chart legend, you can choose to show or hide totals on the legend.
If you did not select the Show pie chart legend option, this check box will be grayed out.
-
To show totals on the chart legend, select the Show totals.
-
To hide totals on the chart legend, clear the Show totals.
| Setting | More Information |
|---|---|
| Show totals selected |

Columns are totaled in the last row. |
| Show totals cleared |
No totals are included. |
Reports With This Setting
Performance Reports
|
|
Holdings Reports
|
|
PDF-Specific Reports
|
|
Related Settings
For more information about date periods, see Dates and Date Periods.
The following setting interacts with this option: