
Contents

How Gradient Chart Works
| Applies to: | ||
|---|---|---|
| Dynamic |
Client Portal |
|
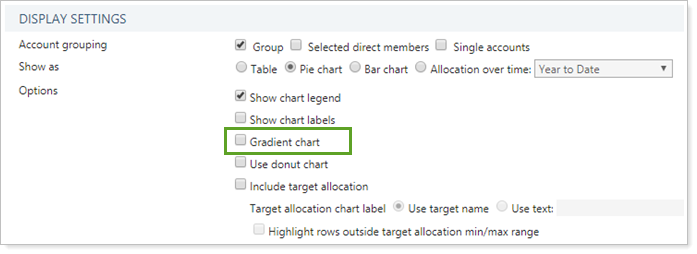
This setting allows you to add shading to charts in PDF reports. It does not change the gradient or color of the background in the chart, but instead adds a gradient to the actual chart elements themselves—the bars in a bar chart, or the pie slices of the pie chart.
You might choose to do this based on your firm's branding preferences in order to achieve a PDF report that achieves your branding goals, or for aesthetic reasons.
Note
Gradient chart replaces the 3D chart setting.

In Dynamic Reports
This setting is available for PDF reports only.
In PDF Reports
In PDF reports, you have the option to add a gradient to the chart. The look of each chart depends on the PDF template theme.
-
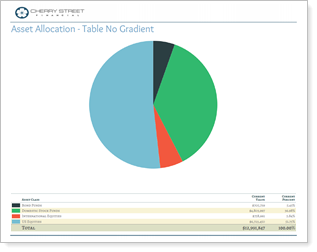
To display charts with standard formatting, clear the Gradient chart check box.
-
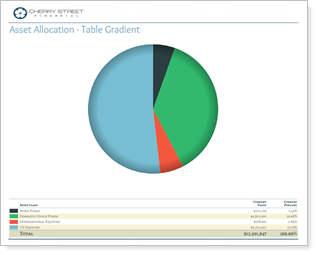
To display charts with a gradient, select the Gradient chart check box.
| Type | Gradient Chart Cleared | Gradient Chart Selected |
|---|---|---|
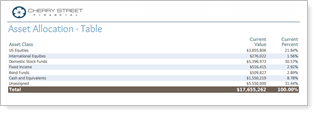
| Table |
|
No change. |
| Pie |
|
|
| Bar |
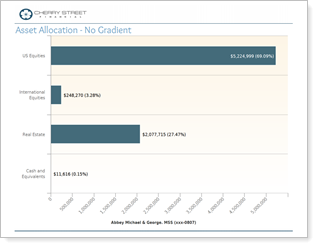
|
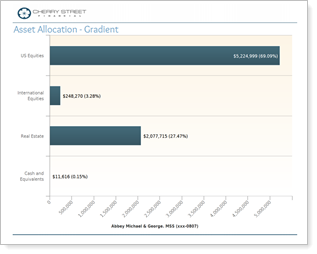
|
| Allocation over Time |
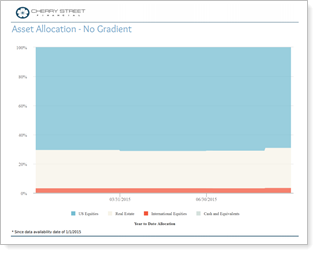
|
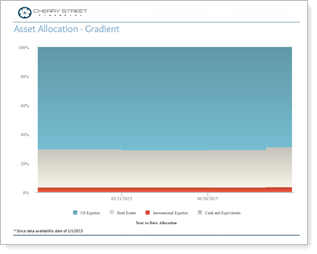
|
Reports With This Setting
Performance Reports
|
|
Holdings Reports
|
|
Related Settings
For more information about PDF themes, see PDF themes. For more information on changing the look of charts and graphs, see Site Themes.
The following processes interact with this option: