
Contents

How Show Bar Chart Works
| Applies to: | ||
|---|---|---|
| ✔ Dynamic |
✔ Client Portal |
|
Many of our reports offer a variety of ways to visually display the data. One option you'll see on several reports is the ability to see the data as a bar chart.
The Show bar chart setting allows you to add a bar chart on the report, and depending on the report type, you can control a variety of characteristics about the chart.
When using a bar chart on performance reporting, most often you'll include benchmarks in the chart to compare returns side by side.

In Dynamic Reports
-
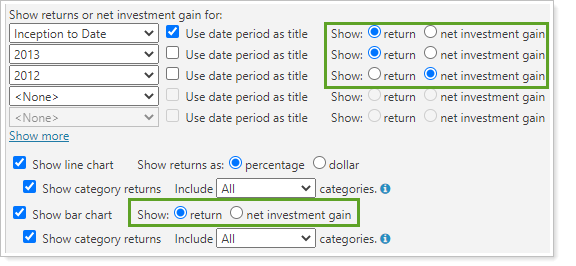
To see the bar chart, select the Show bar chart check box. On the Account Performance report, choose whether you would like to show return or net investment gain.
Note
Only the periods with return types matching your choice for that chart will be displayed.
If all the Show return options are set to the same type for all date periods, the bar chart return type will be set to match.
-
To hide the bar chart, clear the Show bar chart check box.
When you select the Show bar chart check box, the following additional settings become available in the dynamic report.
|
|
Account Performance Report
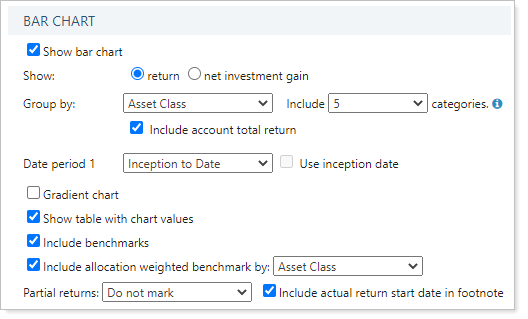
When you select the Show bar chart check box on the Account Performance report, the following settings apply:
-
Show Category/Account Returns. Use this setting to include or exclude returns for the category selected or for accounts.
-
Include ___ Categories/Accounts. Use this setting to designate how many categories or accounts you see on the bar chart.
-
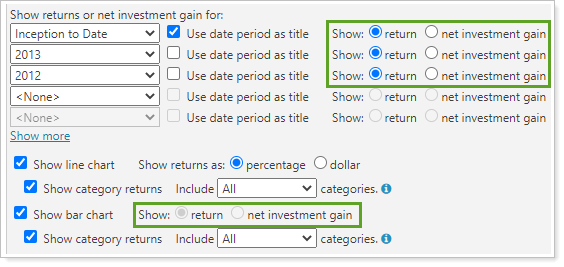
Show: Return or Net Investment Gain. Use this setting to determine how you display performance. The Show return or investment gain setting determines your options for showing return or net investment gain.
When using a bar chart on performance reporting, most often you'll include benchmarks in the chart to compare returns side by side.
| Date periods all set to the same return option... |
|---|
|
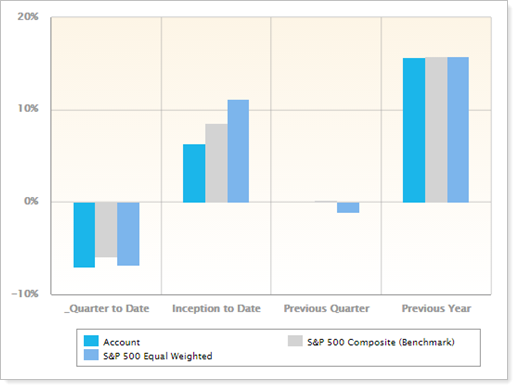
All date periods are set to show returns. |
| The bar chart shown: |
|
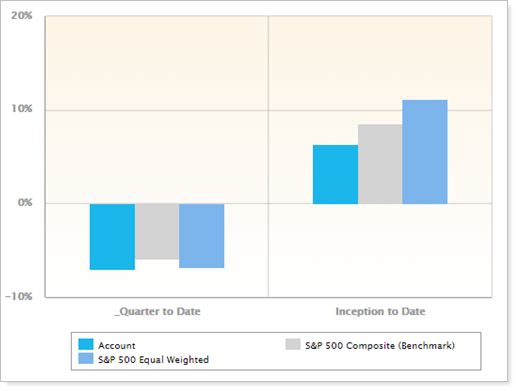
Bar chart Show return or net investment gain option is disabled and the bar chart displays returns for all date periods as a percentage. Notice that the chart shows benchmarks, which you can add using Include Benchmarks. |
| Date periods all set to the different return options... |
|---|
|
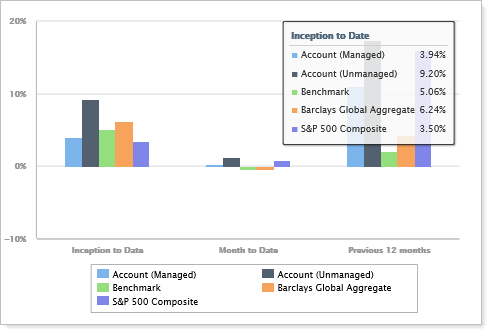
All date periods are set to show a mix of returns and net investment gain. |
| The bar chart shown: |
|
If you choose to show return, the bar chart displays only the date periods set to return. In this example, benchmarks have been added for comparison with the account. To learn more about benchmarks, see Benchmarks. |
Bond Analysis Report
When you select the Show bar chart check box on the Bond Analysis report, the following settings appear.
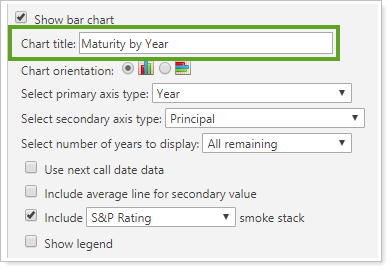
Chart title
This setting lets you add a custom title or no title above the bar chart.
| Setting | More Information |
|---|---|
| Chart title field left blank |
|
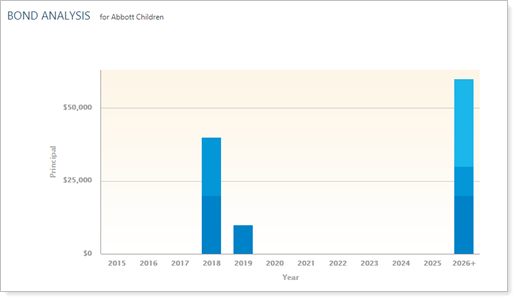
| Chart title field set to "Maturity by Year" |
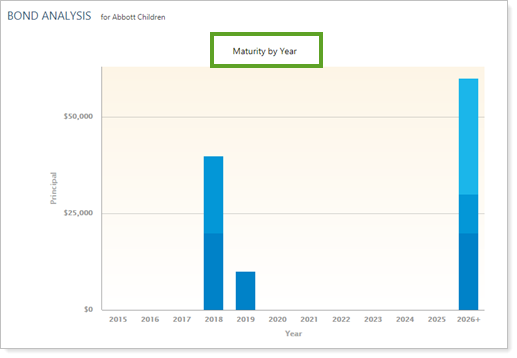
|
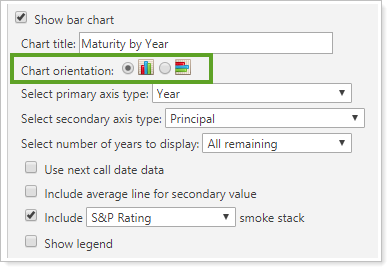
Chart orientation
This setting lets you determine whether the bar chart is laid out horizontally or vertically.
| Setting | More Information |
|---|---|
Chart orientation set to  |
|
Chart orientation set to  |
|
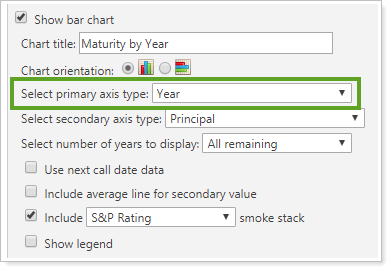
Select primary axis type
This setting lets you set the primary axis (x axis) of the bar chart to any of four options, depending on what you want to evaluate.
You can choose from the following options:
-
Year
-
S&P Rating
-
Moody's Rating
-
Fitch Rating
Note
If you select Moody's Rating or Fitch Rating, the chart will use S&P-style ratings (AAA, BBB, etc.), but the percentages will accurately reflect Moody's Rating or Fitch Rating for the equivalent categories. See the Bond Analysis report for details of how different ratings agencies' ratings are displayed in Advisor View.
| Setting | More Information |
|---|---|
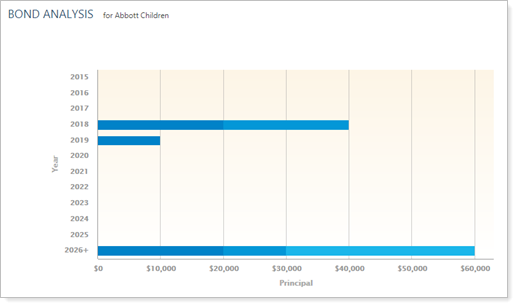
| Select primary axis type set to Year |
When the primary axis is set to year, you can also choose the number of years to be displayed on the primary axis. |
| Select primary axis type set to S&P Rating |
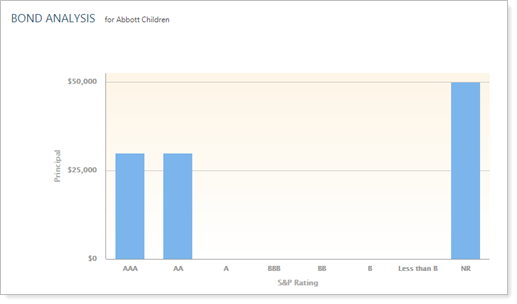
|
| Select primary axis type set to Moody's Rating |
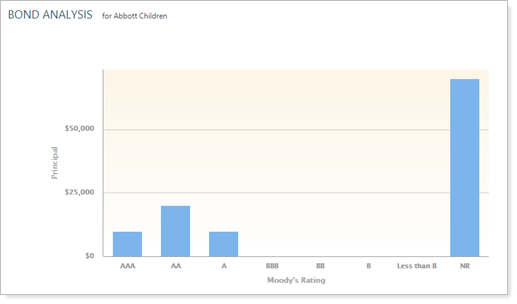
|
| Select primary axis type set to Fitch Rating |
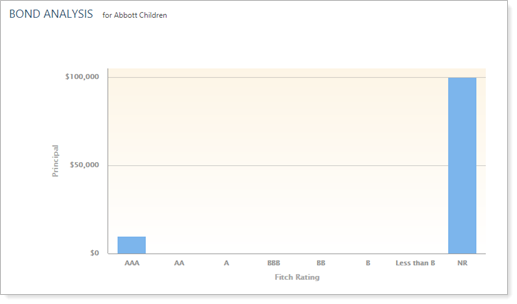
|
Select Secondary axis type
This setting lets you set the secondary axis (y axis) to any of four options, depending on what you want to evaluate.
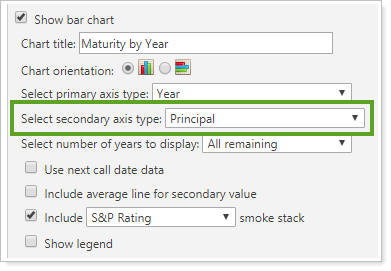
You can choose from the following options:
-
Principal
-
Income
-
Principal and Income
-
Percent of Fixed Income
Note
Chart settings are held constant except for the one setting shown changing. This means that some charts could be displayed more optimally, but are included as shown for consistency.
| Setting | More Information |
|---|---|
| Select secondary axis type set to Principal |
|
| Select secondary axis type set to Income |
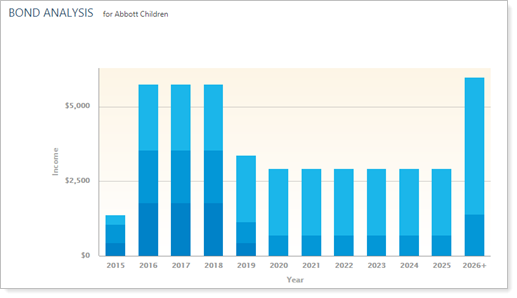
|
| Select secondary axis type set to Principal and Income |
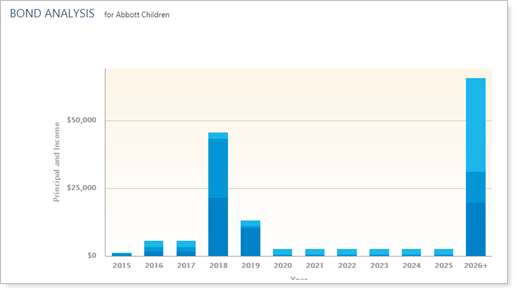
|
| Select secondary axis type set to Yield to Maturity (Cost) |
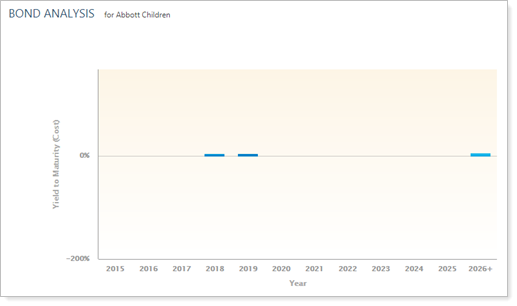
|
| Select secondary axis type set to Yield to Maturity (Market) |
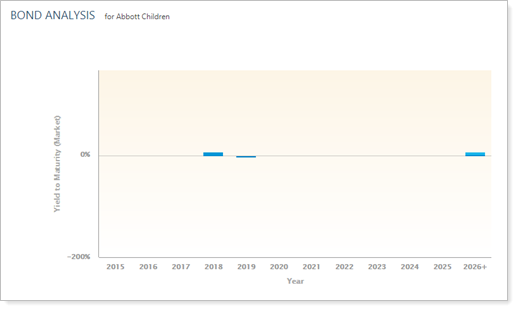
|
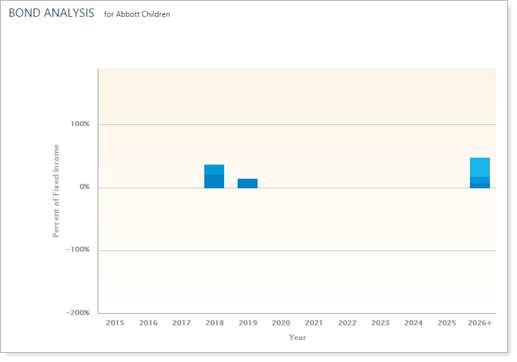
| Select secondary axis type set to Percent of Fixed Income |
|
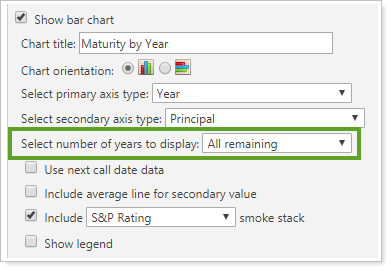
Select number of years to display
When the primary axis is set to year, this setting allows you to choose how many years are displayed on the bar chart.
You can choose from the following:
-
All remaining
-
5 years
-
6 years
-
7 years
-
8 years
-
9 years
-
10 years
-
11 years
-
12 years
| Setting | More Information |
|---|---|
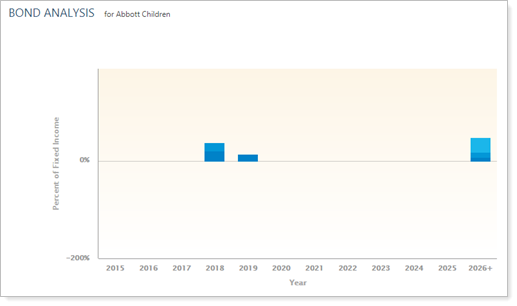
| Select number of years to display set to All remaining |
The chart includes as many years in the primary axis as required to show all bond maturity dates. |
| Select number of years to display set to 5 years |
The selected number of years will be shown in the primary axis, regardless of maturity dates. This example shows 5 years, but the behavior remains the same as you choose any range from 5 years to 12 years. |
Use next call date data
This setting lets you tell the report to use the predetermined date that a bond or preferred stock can be redeemed on before reaching its maturity date for yield maturity calculations. For more information on call dates, see Call Date.
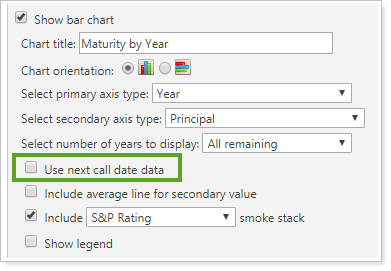
When the Use next call date data check box is selected, the Select secondary axis type list automatically adjusts to Percent of Fixed Income.
| Setting | More Information |
|---|---|
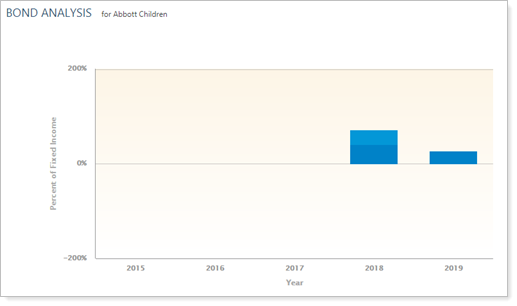
| Use next call date data cleared |
|
| Use next call date data selected |
|
Include average line for secondary value
This setting allows you to add an "average" line for the secondary value to the report.
| Setting | More Information |
|---|---|
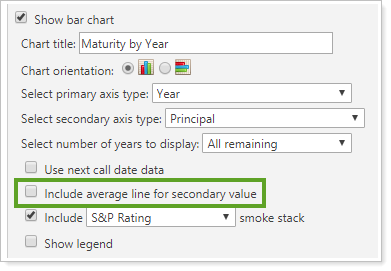
| Include average line for secondary value cleared |
|
| Include average line for secondary value selected |
|
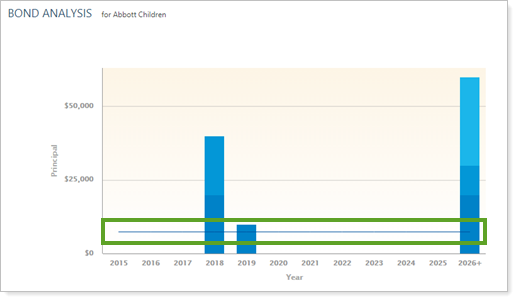
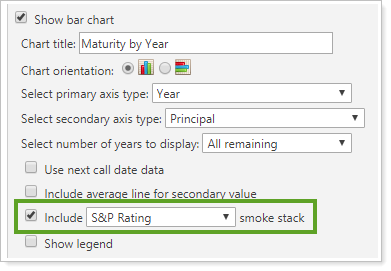
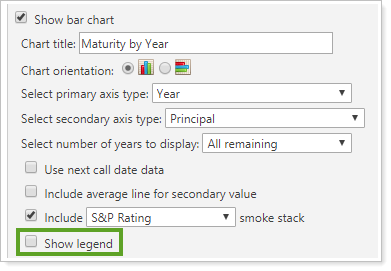
Include _____ rating smoke stack
This setting lets you show the proportion of each rating type comprising each data point total. When you select this check box, you also choose from a drop-down list which rating agency's ratings you want to see.
Rating agencies available for display are:
-
S&P
-
Moody's
-
Fitch
Note
If you select Moody's Rating or Fitch Rating, the chart will use S&P-style ratings (AAA, BBB, etc.), but the percentages will accurately reflect Moody's Rating or Fitch Rating for the equivalent categories. See the Bond Analysis report for details of how different ratings agencies' ratings are displayed in Advisor View.
| Setting | More Information |
|---|---|
| Include _____ rating smoke stack cleared |
|
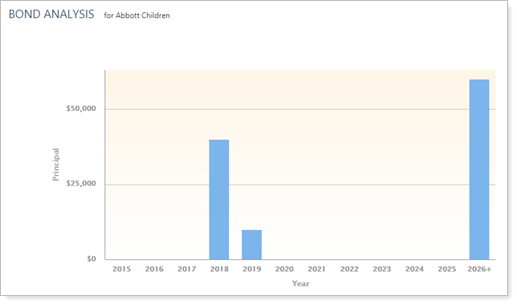
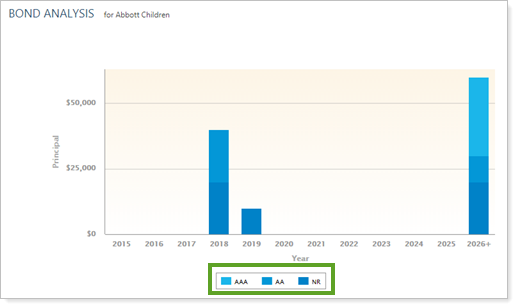
| Include _____ rating smoke stack selected and set to S&P Rating |
Color gradations on each bar indicate the proportion of each rating that appears for each primary axis value. |
Show legend
This setting lets you show or hide a legend for the bar chart.
| Setting | More Information |
|---|---|
| Show legend cleared |
|
| Show legend selected |
|
In PDF Reports
When you select Show bar chart in the PDF template, it includes a bar chart in the report section and gives you the following additional settings to control what the chart includes.
Account Performance Report
The following settings are available in PDF Account Performance reports when you select Show bar chart.
Bond Analysis Report
All the same settings are available and behave the same in the PDF Bond Analysis report.
Reports With This Setting
Performance Reports
|
|
Holdings Reports
|
|
Related Settings
For more information about setting up how charts look in dynamic reports, see Site Themes. For more information about setting up PDF template themes, see PDF Themes.
The following settings are related: