
Contents
|
|

Introduction
| Applies to: | |||
|---|---|---|---|
| ✔ Dynamic | Mobile |
✔ Client Portal |
|
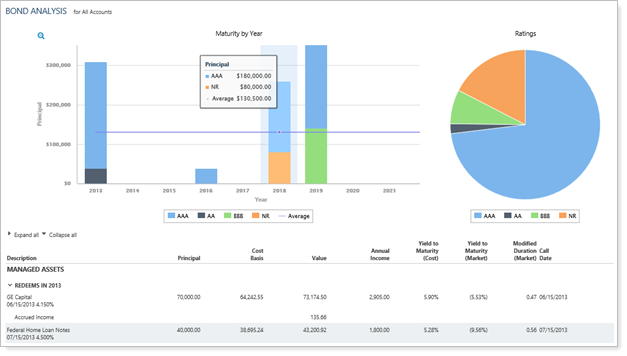
The Bond Analysis report breaks down bond details for fixed income securities in three different displays to help you evaluate different aspects of a client's bond portfolio:
-
Stacked bar chart. See a variety of metrics, such as principal, interest, or yield to maturity, of bonds sorted by rating year, with the stacking breaking out percentage of bonds with each rating for that year.
-
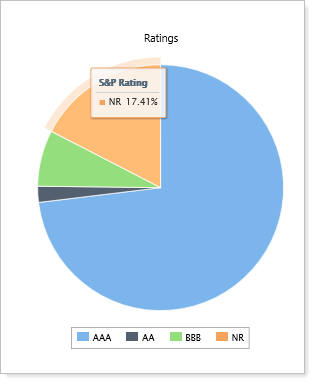
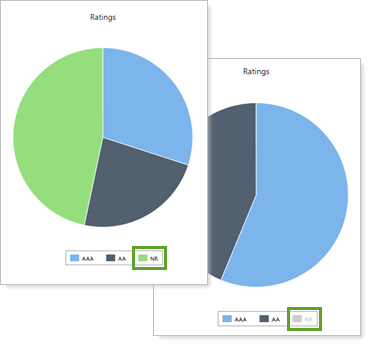
Pie chart. See a pie chart that reflects the proportions of each rating appearing in the total bond portfolio.
-
Table. See details of all the bonds in the client's portfolio, including yield to maturity and modified duration, at cost and at market value, call dates, call prices, call principal, and more.
This report is particularly useful for firms heavily invested in bonds.

Why Use the Bond Analysis Report?
In the Bond Analysis report, you will find versatile sorting and charting options that let you answer many bond-related questions about your clients' portfolios, such as:
-
What are bond maturity details for this portfolio? At its simplest, the Bond Analysis report can expand on the Maturity Schedule report, grouping securities by maturity year and providing extra detail about each security.
-
How Much Income will be paid each year for this portfolio? Quickly generate a bar chart that displays how much income from fixed income securities a portfolio will generate over a certain number of years. Or use it to see principal, yield to maturity, or percent of fixed income, and more.
-
What percentage of my portfolio is AAA-rated bonds? Review the percentage breakdown of all bond ratings within the portfolio displayed in a clear pie chart.
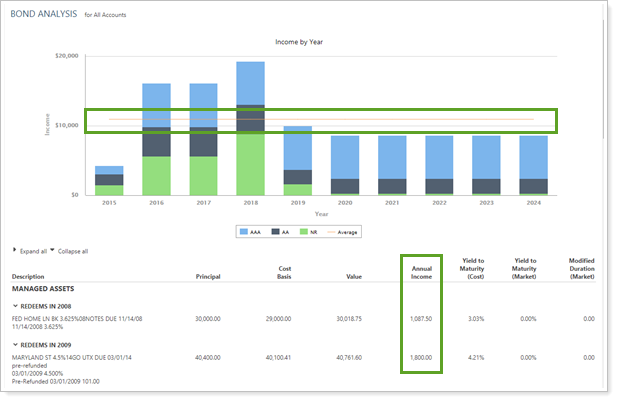
Example 1
An advisor has a client who has been retired for some time. The advisor initially set up a bond ladder to help supplement the client's other income payments. Now, the advisor wants to review the bond ladder to ensure the client's income stream remains uninterrupted over the next few years.
The advisor uses a basic Bond Analysis report to evaluate income by year for the next 10 years, with the Include average line for secondary value selected. This helps the advisor see the average amount of income from fixed income securities. Additionally, the advisor adds the Annual Income column to the table to see how each security contributes.
Features of the Bond Analysis Report
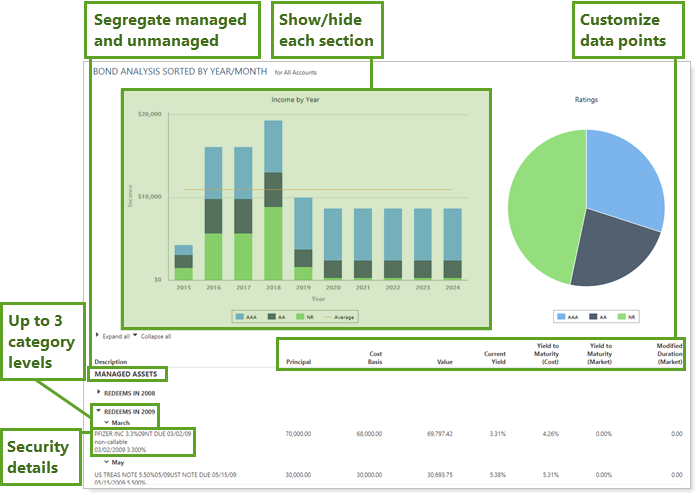
The dynamic Bond Analysis report helps you easily filter and sort data to drill down to meaningful results. Interactive reporting features include:
-
Customize Report Sections. Toggle display of the bar chart for principal/income analysis, the pie chart for bond ratings percentages, or use only the table for detailed security analysis.
-
Tooltips. Hover over a category on the pie or bar chart to see details.
-
Customize zoom. Zoom in on the allocation over time chart by clicking and dragging to select an area. You can then scroll through the zoomed area by holding down the Shift key and dragging to the left or right. Reset your zoomed chart quickly by clicking the
 button.
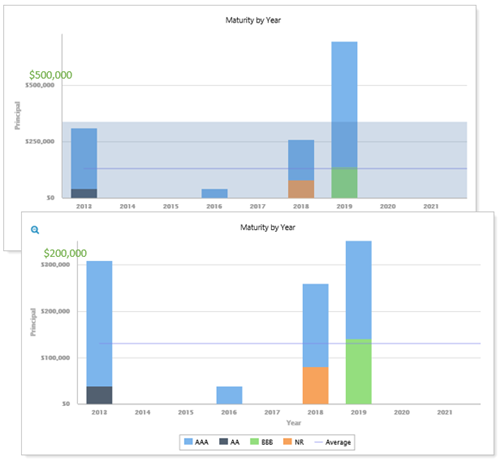
-
Customize Data. Click data points in the chart legend to show/hide data points.
-
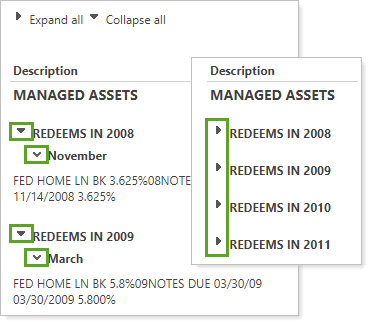
Expand/Collapse. Expand (>) or collapse (˅) table rows to further control the level of detail.
-
customize Columns. Display only relevant data. You control what data are displayed and which columns are included, in what order, so you can create the exact report you need.
Notes
-
You can customize the Managed/Unmanaged labels used for the headings and captions on your reports. These changes can be made on the System Settings page.
-
You can change the name of many columns. For more information, see Available/Selected Columns.
-
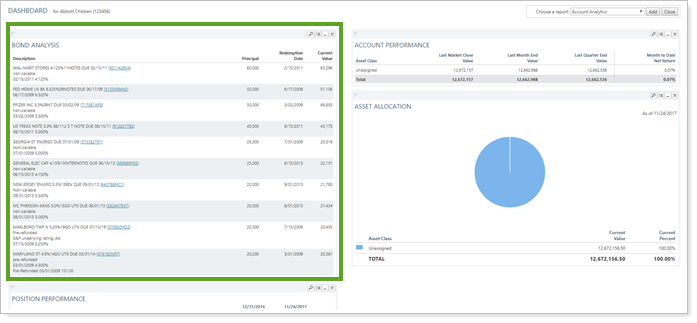
Add Bond Analysis to the Advisor Dashboard
You can use dashboard views to see a pared-down, at-a-glance summary of the main dynamic report on your dashboard.
To learn more about creating and managing dashboard views, see Create and Share Dashboard Views.
For more information on customizing your dashboard, visit Add/Edit/Delete Dashboard Modules.
Bond Analysis Report Settings
The following settings are available for the Bond Analysis report. Click the setting name for more details:
| Setting | Details | Available In... | |||
|---|---|---|---|---|---|
| Dynamic Report | PDF Report | Advisor Dashboard | PDF Dashboard |
||
| Report Name | Designate a unique name for the report view. | X | X | ||
| Mark as Publicly Accessible | Share the report view. | X | |||
| Section Title | Designate what the section will be called in the PDF report. | X | X | ||
| Theme | Designate what theme the section will use. | X | |||
| Header and Footer | Choose a unique header and footer for the section or use defaults. | X | |||
| Include Page Break After This Section |
Control where page breaks occur in PDF reports. |
X | |||
| Account Grouping | Control grouping of accounts and groups. | X | |||
| Group By/Then By |
Organize a report by various categories. Includes related setting:
|
X | X | ||
| Show Bar Chart |
Show or hide the bar chart. Includes the following related settings:
|
X | X | X | |
| Show Ratings Pie Chart |
Show or hide the pie chart that shows ratings percentages. Includes the following related settings:
|
X | X | ||
| Unmanaged Asset Treatment |
Choose how you want to treat unmanaged assets on the report. NoteFor more information about marking securities as unmanaged and how reports display unmanaged assets, see How Reports Handle Unmanaged Assets. |
X | X | ||
| Combine Group Positions | Combine any common positions that are held within a selected group. | X | X | ||
| Show Lot Level Detail | View detailed information about the holdings at the trade lot level. | X | X | ||
| Include the Following Security Types | Designate what securities are included in the report. | X | X | X | X |
| Available/Selected Columns | Choose which columns, rows, indices, or benchmarks are included and in what order. | X | X | X | |
| Show Position Detail |
Show or hide underlying positions that make up subtotals. Includes related settings:
|
X | |||
| Show Maturity Ladder, Positions Table, Bar Chart, or Ratings Pie Chart |
Set what bond analysis-related information you want displayed in the PDF Dashboard panel. Includes related settings:
|
X | |||
To learn more about general dynamic reports settings, including how to customize columns, add footers, and more, see:
Report Actions
You can do any of the following actions with the REPORT NAME report:
| Action | Available in Dynamic Report | Available in PDF Report | |
|---|---|---|---|
| Run Report | Run dynamic report or PDF template. | X | X |
| Edit Report | Edit report view or template. | X | X |
| Copy Report | Copy report view or template. | X | X |
| Delete Report | Delete report view or template. | X | X |
| Share Report | Share report view or template with other firm users. | X | X |
| Export to Excel | Export report data to a CSV file. | X | X |
| Print Report | Print a dynamic report. | X | X |
| Site Themes | Edit how the dynamic report looks. | X | |
| Learn More About Customizing How PDF Templates Look | Edit how the PDF report looks. | X |
Bond Analysis Ratings Pie Chart Agency Rating Scale
On the pie chart for the Bond Analysis report, Advisor View uses the conversion mapping.
Fitch Ratings
| Rating Service | Rating | Advisor View Rating |
|---|---|---|
| Fitch | A | A |
| Fitch | AA | AA |
| Fitch | AAA | AAA |
| Fitch | AAMinus | AA |
| Fitch | AAPlus | AA |
| Fitch | AMinus | A |
| Fitch | APlus | A |
| Fitch | B | B |
| Fitch | BB | BB |
| Fitch | BBB | BBB |
| Fitch | BBBMinus | BBB |
| Fitch | BBBPlus | BBB |
| Fitch | BBMinus | BB |
| Fitch | BBPlus | BB |
| Fitch | BMinus | B |
| Fitch | BPlus | B |
| Fitch | Bshort | B |
| Fitch | C | Less than B |
| Fitch | CC | Less than B |
| Fitch | CCC | Less than B |
| Fitch | CCCMinus | Less than B |
| Fitch | CCCPlus | Less than B |
| Fitch | CCMinus | Less than B |
| Fitch | CCPlus | Less than B |
| Fitch | CMinus | Less than B |
| Fitch | CPlus | Less than B |
| Fitch | CShort | Less than B |
| Fitch | D | Less than B |
| Fitch | DD | Less than B |
| Fitch | DDD | Less than B |
| Fitch | DShort | Less than B |
| Fitch | F1 | NR |
| Fitch | F1Plus | NR |
| Fitch | F2 | NR |
| Fitch | F3 | NR |
| Fitch | FDashS | NR |
| Fitch | Insured | NR |
| Fitch | NR | NR |
Moody's Investor Service Ratings
| Rating Service | Rating | Advisor View Rating |
|---|---|---|
| Moody | A1 | A |
| Moody | A2 | A |
| Moody | A3 | A |
| Moody | Aa1 | AA |
| Moody | Aa2 | AA |
| Moody | Aa3 | AA |
| Moody | Aaa | AAA |
| Moody | B1 | B |
| Moody | B2 | B |
| Moody | B3 | B |
| Moody | Ba1 | BB |
| Moody | Ba2 | BB |
| Moody | Ba3 | BB |
| Moody | Baa1 | BBB |
| Moody | Baa2 | BBB |
| Moody | Baa3 | BBB |
| Moody | C | Less than B |
| Moody | Ca | Less than B |
| Moody | Caa1 | Less than B |
| Moody | Caa2 | Less than B |
| Moody | Caa3 | Less than B |
| Moody | Insured | NR |
| Moody | MIG1 | NR |
| Moody | MIG2 | NR |
| Moody | MIG3 | NR |
| Moody | MIG4 | NR |
| Moody | NPRIM | NR |
| Moody | NR | NR |
| Moody | P1 | NR |
| Moody | P2 | NR |
| Moody | P3 | NR |
| Moody | PRIM1 | NR |
| Moody | PRIM2 | NR |
| Moody | PRIM3 | NR |
| Moody | SG | NR |
| Moody | VMIG1 | NR |
| Moody | VMIG2 | NR |
| Moody | VMIG3 | NR |
| Moody | VMIG4 | NR |
Standard & Poor's Global Ratings
| Rating Service | Rating | Advisor View Rating |
|---|---|---|
| S&P | A | A |
| S&P | AA | AA |
| S&P | AAA | AAA |
| S&P | AAMinus | AA |
| S&P | AAPlus | AA |
| S&P | ADash1 | A |
| S&P | ADash2 | A |
| S&P | ADash3 | A |
| S&P | AMinus | A |
| S&P | APlus | A |
| S&P | B | B |
| S&P | BB | BB |
| S&P | BBB | BBB |
| S&P | BBBMinus | BBB |
| S&P | BBBPlus | BBB |
| S&P | BBMinus | BB |
| S&P | BBPlus | BB |
| S&P | BMinus | B |
| S&P | BPlus | B |
| S&P | BShort | B |
| S&P | C | Less than B |
| S&P | CC | Less than B |
| S&P | CCC | Less than B |
| S&P | CCCMinus | Less than B |
| S&P | CCCPlus | Less than B |
| S&P | CShort | Less than B |
| S&P | D | Less than B |
| S&P | DShort | Less than B |
| S&P | Insured | NR |
| S&P | NR | NR |
| S&P | SPDash1 | NR |
| S&P | SPDash2 | NR |
| S&P | SPDash3 | NR |