
Contents
|
|

How Show Maturity Ladder, Positions Table, Bar Chart, or Ratings Pie Chart Works
| Applies to: | ||
|---|---|---|
| Dynamic |
Client Portal |
|
When you add the Bond Analysis report to a PDF dashboard, you can choose to show any of four different types of bond-related information:
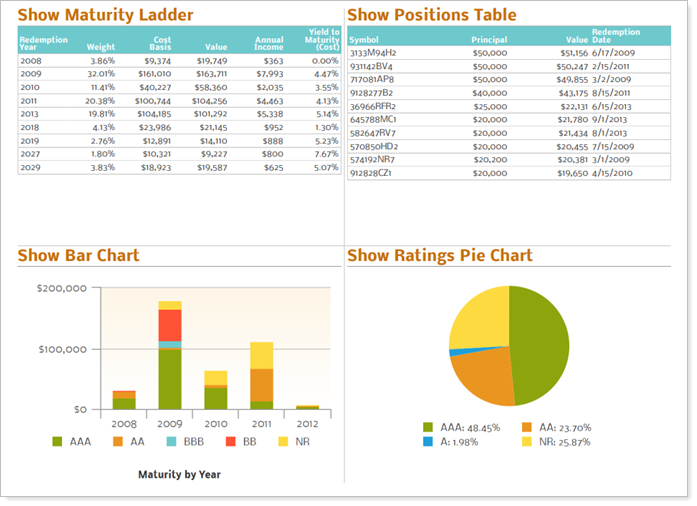
This setting allows you to select which bond analysis information is displayed in the PDF Dashboards panel and to configure the settings unique to that selection. Which one you choose, and how you configure its settings, depends on what you're trying to communicate with the dashboard.

In Dynamic Reports
This setting is only available in the Bond Analysis section of the PDF Dashboard.
In PDF Reports
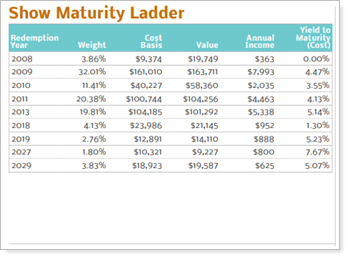
Show Maturity Ladder
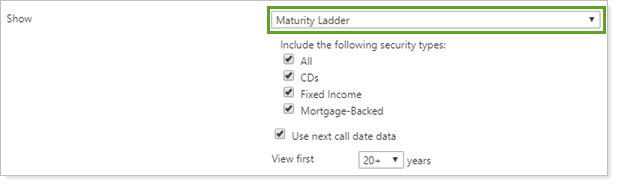
To add a maturity ladder to the PDF Dashboard section, in the Show list, select Maturity Ladder. When you select Maturity Ladder, the following settings are available:
-
Use the next call date data (setting details available under Show Bar Chart)
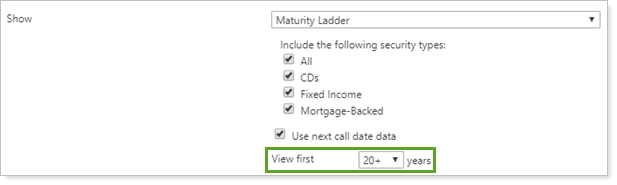
View First X Years
This setting allows you to set how many years are shown in the maturity ladder in the PDF Dashboard panel. You can choose to display:
-
5
-
10
-
15
-
20
-
20+
| Setting | More Information |
|---|---|
| View first set to 5 years |
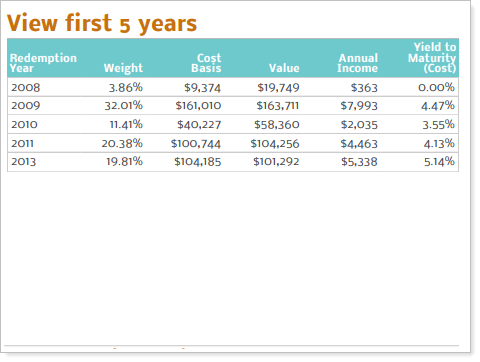
Redemptions occurring in the next five years are displayed. |
| View first set to 20+ years |
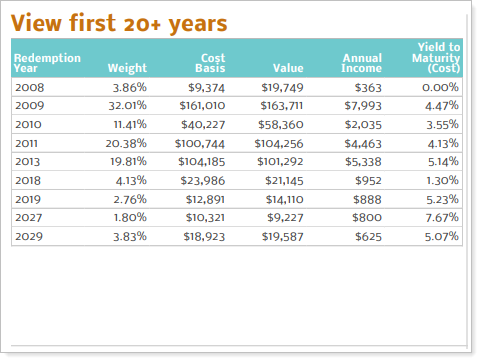
Redemptions occurring for all future years are displayed. |
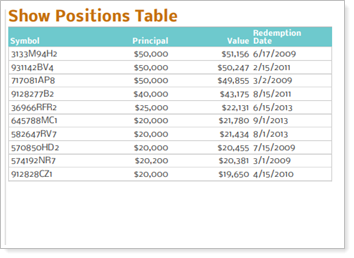
Show Positions Table
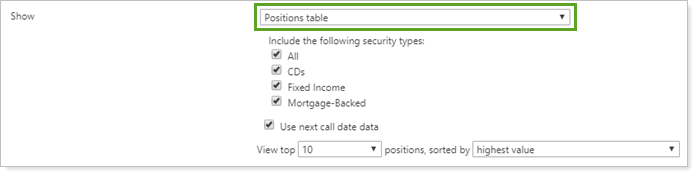
To add a positions table to the PDF Dashboard section, in the Show list, select Positions table. When you select Positions table, the following settings are available:
-
Use the next call date data (setting details available under Show Bar Chart)
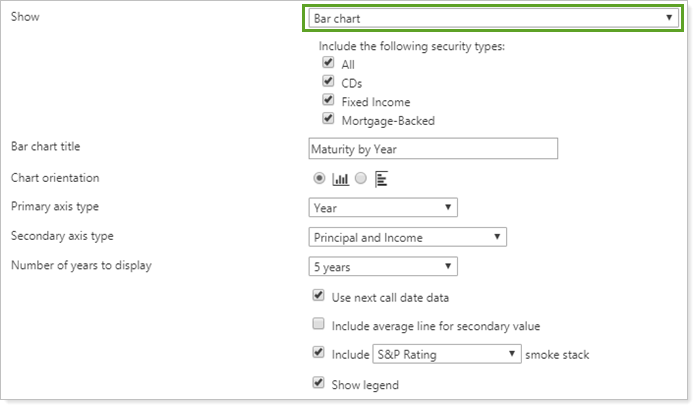
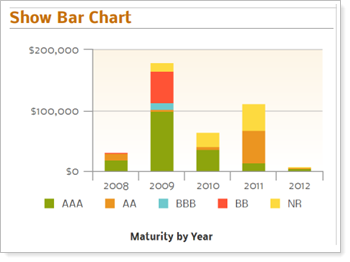
Show Bar Chart
To add a bar chart to the PDF Dashboard section, in the Show list, select Bar chart. When you select Bar chart, the following settings are available:
-
Settings detailed under Show Bar Chart:
-
Bar chart title
-
Cart orientation
-
Primary axis type
-
Secondary axis type
-
Number of years to display
-
Use next call date data
-
Include average line for secondary value
-
Include ____ smoke stack
-
Show legend
-
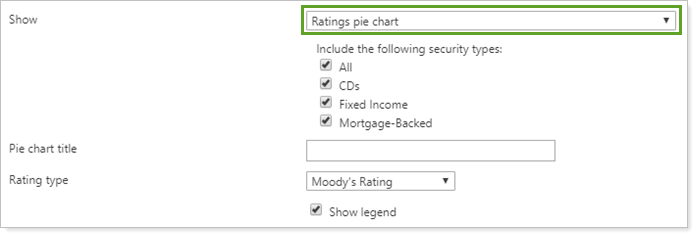
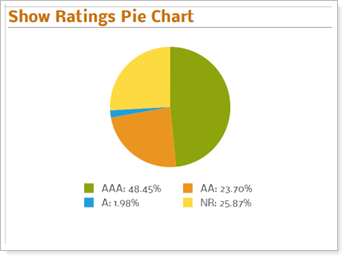
Show Ratings Pie Chart
To add a ratings pie chart to the PDF Dashboard section, in the Show list, select Ratings pie chart. When you select Ratings pie chart, the following settings are available:
-
Rating type (setting details available under Show Ratings Pie Chart)
-
Show legend (setting details available under Show Ratings Pie Chart)
Reports With This Setting
PDF-Specific Reports
|
|
Holdings Reports
|
|
Related Settings
The following is related to this setting: