Back
Back Home > Advisor View > Reports > Dynamic and PDF Reports > PDF Template Customization > Customize How PDF Templates Look > PDF Themes
|
Back |
Home > Advisor View > Reports > Dynamic and PDF Reports > PDF Template Customization > Customize How PDF Templates Look > PDF Themes
|
PDF Themes
With PDF Themes, you control the look and feel of many global items in your reports, such as colors, number precision, display of negative numbers, and more.

Themes give you these important features:
Complete control over report formatting. With report themes, you can create a consistent look for all of your reports. When setting up your report, you control the font, font color, font size, and font alignment for each report section.
More fonts. We added over 40 fonts to Advisor View to make it easier for you to add a little something extra to the reports you create.
Show or Hide Dollar Signs. Show dollar signs in front of dollar amounts or hide them on your reports - it's up to you.
Set the default format for negative numbers. You can choose how you want to display negative numbers on your reports. Use parentheses for negative numbers or use a dash.
number precision. You have complete control over the number of decimal places to display for each field type on your reports - for example, you can specify three decimal places for mutual fund shares and two decimal places for dollar amounts.
Set the page orientation independently for each report section. In prior releases of Advisor View, it was easy to set the page orientation for an entire report. But some users wanted to have portrait and landscape page orientation in the same report. With themes, you can specify the page orientation independently for each report section.
To create your report themes:
On the Client Reporting menu, click PDF Themes. The Themes page appears.
In the Select a theme list, click Create new theme.

Type a name for the theme in the Theme name box. The name you specify cannot exceed 64 characters including spaces.
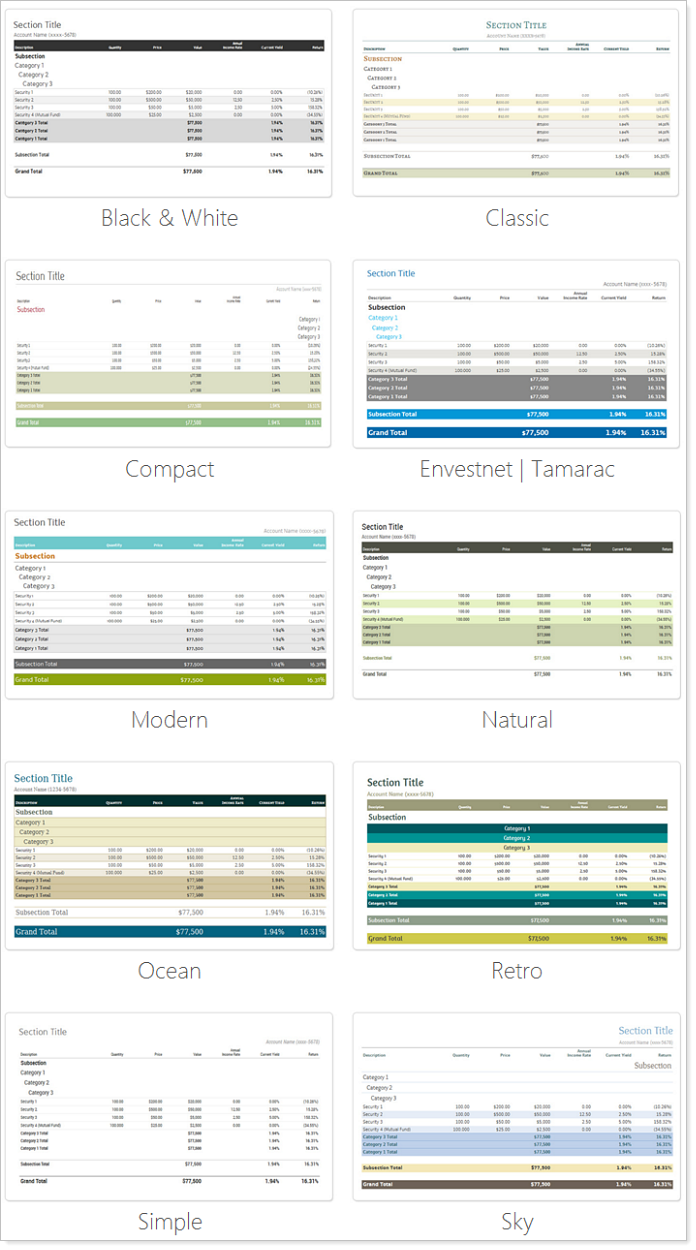
In the Report theme list, choose a report theme for the report. Report themes allow you to change the colors and options used in pie, bar, and line charts. Unlike PDF themes, report themes can apply to both dynamic, PDF reports, and client portals. For more information, visit Report Themes.
Under Page orientation, choose a page orientation for the report theme. Your choices are Landscape or Portrait.
Set the top, bottom, left and right margins for the report in inches.

In the Item list, choose the information you want to customize.
Your choices are:
|
|
Customize any of the following settings for the report theme:
As you make your changes, Advisor View updates the sample report at the bottom of the page to show you how your settings will appear on the report.
| This Setting... | Does This... | ||||
|---|---|---|---|---|---|
|
Font Button
|
Choose the font for the item you selected in the Item list. | ||||
|
Font Size List
|
Choose a font size for the item you selected in the Item list. | ||||
|
Bold Button
|
Formats the font as bold. | ||||
|
Italics Button
|
Formats the font as italicized. | ||||
|
Font Color
|
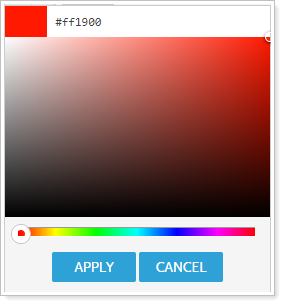
Changes the color of the font. When you click this button, the Color Selection window appears.
Select a color or enter an exact hexadecimal value in the large box at the top. Click Apply to close the dialog and save you changes. |
||||
|
Background Color Button
|
Changes the background color of the item. When you click this button, the Color Selection window appears.
Select a color or enter an exact hexadecimal value in the large box at the top. Click Apply to close the dialog and save you changes. |
||||
|
Left Justify Button
|
Left justifies the text for the item you selected in the Item list. This setting will only appear for the following items:
|
||||
|
Center Button
|
Centers the text for the item you selected in the Item list. This setting will only appear for the following items:
|
||||
|
Right Justify Button
|
Right justifies the text for the item you selected in the Item list. This setting will only appear for the following items:
|
||||
|
Top Border Button
|
Adds a border to the top of the item you selected in the Item list. The width of the border is 1px. As of this release, you cannot control the width of the border. In the picture below, the blue line represents a top border for the grand total line:
You can customize the color of the border by clicking the Border Color button. |
||||
|
Bottom Border Button
|
Adds a border to the bottom of the item you selected in the Item list. The width of the border is 1px. As of this release, you cannot control the width of the border. In the picture below, the blue line represents a bottom border for the grand total line:
You can customize the color of the border by clicking the Border Color button. |
||||
|
Left Border Button
|
Adds a border to the left of the item you selected in the Item list. The width of the border is 1px. As of this release, you cannot control the width of the border. In the picture below, the blue line represents a left border for the grand total line:
You can customize the color of the border by clicking the Border Color button. |
||||
|
Right Border Button
|
Adds a border to the right of the item you selected in the Item list. The width of the border is 1px. As of this release, you cannot control the width of the border. In the picture below, the blue line represents a right border for the grand total line:
You can customize the color of the border by clicking the Border Color button. |
||||
|
Border Color Button
|
Changes the color of the borders (if any) for the item. When you click this button, the Color Selection window appears.
Select a color or enter an exact hexadecimal value in the large box at the top. Click Apply to close the dialog and save you changes. The color you select will change the border color for all borders for the item. As of this release, you cannot specify a different color for each border – for example, you can’t have a blue top border and a green bottom border. |
||||
|
Show dollar signs
|
If you select this check box, Advisor View will include a dollar sign ($) before any dollar amounts in the report. This setting affects the entire theme and not just the item you selected in the item list. For example, you can’t show dollar signs for the Data Row and then hide them for the Alternate Data Row. |
||||
|
Use parentheses for negative valued
|
If you select this check box, Advisor View will differentiate negative numbers from positive numbers by using parentheses – for example, $(1,000). If you do not select this check box, Advisor View will differentiate negative numbers from positive numbers by using a dash - for example, -$1,000. This setting affects the entire theme and not just the item you selected in the item list. For example, you can’t use parentheses for the Data Row and a dash for the Alternate Data Row. |
||||
| Show category color keys |
When you select this option, Advisor View will place a color key next to the items on your report.
This setting affects the entire theme and not just the item you selected in the item list. For example, you can’t show the color key for Category 1 and hide it for Category 2. For more information on setting up color keys, visit the Color Options section of Report Themes. |
||||
| Obscure Account Numbers |
Select this check box if you want only the last four digits of an account number shown on the report for privacy reasons. When selected, x will appear in place of all digits except the last four numbers of an account number.
This setting affects the entire theme and not just the item you selected in the item list. |
||||
| Display date in column headers for date periods of Inception to Date |
some advisors want the flexibility to show the actual inception date on the column header. With this release, you can show the actual inception date in column headings.
By default, Advisor View does not show the inception date in the column heading. Select this check box if you want Advisor View to show the inception date. |
||||
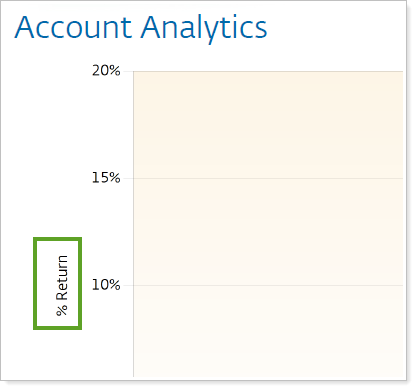
| Display y axis graph labels |
When creating reports with y-axis labels, you can specify if the labels appear vertically or horizontally.
|
||||
| Number Precision | |||||
| Dollar amounts |
Choose how you want dollar amounts to appear on your reports. Examples of fields that this setting affects include total value, cost basis, and realized gain/loss. Your choices are:
|
||||
| Shares (non-mutual funds) |
Choose how you want the number of shares (often displayed as Quantity on reports) to appear on your reports. This number setting does not control the appearance of mutual fund shares. Your choices are:
|
||||
| Shares (mutual funds) |
Choose how you want the number of mutual fund shares (often displayed as Quantity on reports) to appear on your reports. This number setting does not control the appearance of mutual fund shares. Your choices are:
|
||||
| Prices |
Choose the number of decimal points you want to appear for prices on your reports. Your choices are:
|
||||
| Decimal amounts |
Choose how you want decimal amounts to appear on your reports. Examples of fields that this setting affects include annual income rate and duration. Your choices are:
|
||||
| Percentages |
Choose the number of decimal places you want to appear for percentages on your reports. This setting does not affect yield percentages. Your choices are:
|
||||
| Yields |
Choose the number of decimal places you want to appear for yield percentages on your reports. Your choices are:
|
||||
| Billing Rate |
Choose the number of decimal places you want to appear for the billing rate on your billing statement. |
||||
| Calendar Dates |
Choose the format that you want calendar dates to appear on your reports.
|
||||
When finished customizing the theme, click Save.
If you want to make changes to a theme you've already created:
On the Client Reporting menu, click PDF Themes.
In the Select a theme list, choose a theme that you want to modify.

Make the necessary changes to the theme, and then click Save. For more information on each setting on this page, visit Create a Theme.
To delete a theme:
On the Client Reporting menu, click PDF Themes.
In the Select a theme list, choose the theme you want to delete.
Click Delete.
To make a copy of a theme:
On the Client Reporting menu, click PDF Themes.
In the Select a theme list, choose the theme you want to copy.
In the Theme name box, type a name for the new theme.
Click Save As New.
Once you've created a theme, you can assign it to a PDF template or a PDF section.
To assign a theme:
On the Client Reporting menu, click PDF Themes.
Under General Settings, in the Theme list, choose the default theme you want to assign to the report.

Click Save.
For each section, you can assign a different theme or you can use the same theme for the entire report.
If you want to assign a unique theme to a PDF section, click the section where you want to assign a unique theme. In the Themes list for the report section, click the theme you want to assign to the section.

To help you get the most out of the new report improvements, our graphic designers have created report themes and report themes that will help you take your PDF reports to the next level.