
Contents
|
|

Introduction
This page provides a high-level overview of reporting available in the Tamarac platform. It discusses the types of data available for reporting, the types of reports you can use to analyze that data, a summary of each report with links to a topic with report details, and links to steps for generating different types of reports.

Data You Can Report On
Performance Data
Performance reports offer an analysis of returns, investment gains or losses, and, in some cases, statistics over a period of time you select. They allow you to compare account values and holdings with returns and evaluate the impact of different investment decisions on accounts or groups. Some reports allow you to compare the performance of accounts within a group or positions within an account, while others provide configurable, high-level summaries of the period you choose.
For a list of all performance reports available in Tamarac, see Learn More About Performance Reports.
Holdings Data
Holdings reports generally offer a way to see a snapshot of what an account or group held at a particular time. Different reports allow you to evaluate different holdings, such as committed capital, bonds, and fixed income, with features specifically designed to facilitate analyzing that those holdings types. Other holdings allow you to analyze the allocation of assets held in an account or group and compare that with target allocations.
For a list of all holdings reports available in Tamarac, see Learn More About Holdings Reports.
Transactions Data
Transaction reports offer a way to track the activity of accounts or groups, including inflows and outflows like deposits, withdrawals, income payments, transfers, and more. Some reports allow you to focus on the flow of capital, while others focus on recent trades, income, or gains and losses.
For a list of all transaction reports available in Tamarac, see Learn More About Transaction Reports.
Financial Plans, Business Insights, and Compliance
Financial planning reports give you access to a client's financial plan progress.
Business intelligence reports give you insights into your firm and gives you access to compliance reporting.
Types of Reports
The following are the different reporting tools you can use Tamarac to analyze performance, holdings, transaction, and trading data. Each type of report meets specific needs and provides specific results, which are discussed here.
For a summary of each report and its type, see Available Dynamic and PDF Reports.
For a list of all reports, see Learn More About The Available Dynamic and PDF Reports.
Dynamic Reports
Interactive dynamic reports are fully configurable reports that allow you to evaluate characteristics of a financial account, group for reporting, account set, or, depending on the report, Household. Dynamic reports allow you to explore patterns, answer questions about trends or anomalies, and ask related questions, changing how the report looks on the fly to dig deeper.
To streamline daily workflows, you can include summary versions of dynamic reports on the dashboard. You can choose from among almost all your dynamic report views to build customized dashboards that focus on particular characteristics, such as daily transaction activity.
Client portals can include the dynamic reports of your choosing, and the mobile app gives clients access to this dynamic functionality anywhere, anytime. This allows you to give clients the ability to dynamically interact with their data on-screen with real-time data.
Dynamic reports serve you well when you want to:
-
Evaluate a client's financial accounts or groups with real-time data and interactive features for drilling into details.
-
Give clients real-time access to performance, holdings, or transaction data.

Characteristics
-
Formatted for on-screen viewing; not designed to print.
-
Interactive features including tooltips displaying additional data, on-the-fly zooming, column sorting, expanding/collapsing rows, and show/hide data points.
-
Export allows you to download a CSV file of the data from reports for further analysis.
-
Change settings and see the impact immediately. For example, quickly see the difference between net and gross flows or IRR and TWR.
-
See data summarized on the Reporting dashboard, with quick access to open the full report.
Where to Access
Access the dynamic reports from the Reports menu.

Remember, you will only see reports available based on permissions granted to your user.
PDF Reports
PDF reports are fully configurable static reports generated based on templates that are designed to be printed or shared as PDF files or printed statements. They allow you to create professional, branded financial statements and quarterly reports that you share with your clients by mail or through the client portal document vault. With PDF reports, you can create different reports for different clients, providing targeted reporting appropriate for each client's needs.
You can build PDF templates using sections that offer the same performance, holdings, and transactions reporting available as dynamic reports. The difference is that, since these reports are generated as a PDF, they represent a static version of the data. And you can find some additional, unique sections in PDF reports, including the PDF dashboard, Account Ledger, Performance History, and more.
Many advisors also choose to include billing invoices as a section in their PDF reports. This allows advisors to emphasize the firm's value alongside the invoice, and streamlines client communications.
PDF reports serve you well when you want to:
-
Send clients a financial statement summarizing their financial situation for the month, quarter, or year.
-
Provide a billing statement alongside reporting, or as a completely separate PDF document.
For more information about creating PDF reports, see Learn More About PDF Reports and Templates.
Characteristics
-
Designed to print well; produces a professional quality financial statement.
-
Not dynamically interactive.
-
Good for clients not comfortable with computers or digital client portal access.
-
Templates allow firm branding, with different branding for different clients.
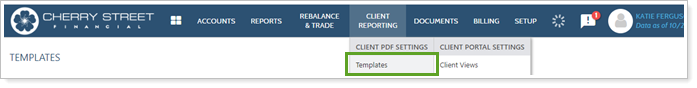
Where to Access
You can access PDF reports from Templates under the Client Reporting menu.
Remember, you will only see reports available based on permissions granted to your user.
Bulk Reports and Uploads
Bulk reports export account, client, Household, performance, holdings, transaction, trading, and securities data from Tamarac into comma-delimited (CSV) files. They aggregate large amounts of data from across many different areas of Tamarac, allowing you to export and analyze data from disparate sources. If you want to do complex spreadsheet-based analyses, bulk reports give access to all the data you need.
Bulk reports work in tandem with bulk data uploads to allow you to edit many records in Tamarac at once. The bulk report extracts the data you want to edit from Tamarac; you can then edit the desired data and use an upload to insert it back into Tamarac.
Additionally, you can combine bulk reports and saved searches to create custom views that give you access to complex analysis tools within Tamarac.
Bulk reports serve you well when you want to:
-
Extract large amounts of data across accounts, groups, Households, or account sets.
-
Evaluate a large number of records.
-
Edit large amounts of data using uploads.
For more information, see Bulk Reports and Bulk Data Uploading.

Characteristics
-
Comma-delimited (CSV) files downloaded onto your computer.
-
Fully customizable data drawn for diverse sources in Tamarac.
-
Useful for analysis, bulk uploads, and custom views.
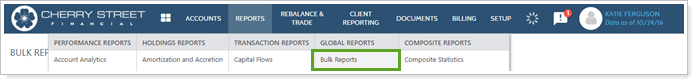
Where to Access
You can access the bulk reports from the Reports menu under Global Reports.
Remember, you will only see reports available based on permissions granted to your user.
Available Dynamic and PDF Reports
Advisor View provides several report types and associated initial versions of each. If an X appears in the Dynamic column, the report is available as a dynamic report. If an X appears in the PDF column, it is available to add to a PDF template.
Click the report title in the Report column to learn how to customize the report.
| Report Name | Description | Dynamic | |
|---|---|---|---|
| Performance Reports | |||
| Account Analytics |
With the Account Analytics report you can chart risk-adjusted comparisons to benchmarks and indexes for your client portfolios. You can customize the report with relative statistics and portfolio metrics to better manage risk-adjusted returns. Report options include standard deviation, Sharpe ratio, alpha and beta, upside/downside capture, information ratio, and more. |
X | X |
| Account Ledger |
The Account Ledger section provides a tabular view of account performance for all accounts in the report. You can select up to five periods to view. You can also set custom column widths for this report and preview it to determine if the data fits as expected. |
X | |
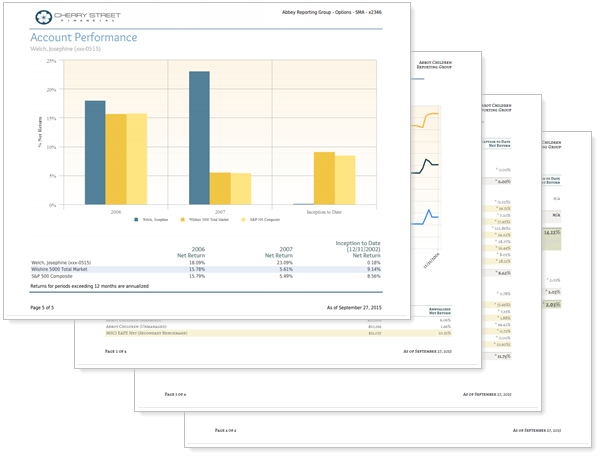
| Account Performance |
The Account Performance report presents account values. The report includes a line graph for one performance period and a bar graph showing up to 12 return periods. Target benchmarks can be added in both the basic and chart views. You can drill down on the performance for each account to view either underlying holdings or underlying accounts. |
X | X |
| Comparative Review |
This report shows you consolidated totals for your accounts for a particular date range in both IRR and TWR. This report can also show you how the value of your accounts is distributed among your asset classes. You can set custom column widths for this report and preview it to determine if the data fits as expected. |
X | X |
| Interval Performance |
This report is useful for troubleshooting spikes and dips in performance. This report is intended for advisor use only. |
X | X |
| Performance History |
This report compares performance for an account or group with multiple date periods and categories (such as asset classes). For example, you can look in the Net Investment Gain column to see what that value was for each month. Or you could compare the end value for each quarter in order to identify performance patterns. |
X | |
| Position Performance |
The Position Performance report section displays the performance of the portfolio’s individual positions based on selected metrics and groupings. |
X | X |
| Summary |
The Summary section provides a chart view for up to five time periods and table of data that compares the portfolio performance to selected indexes. |
X | X |
| Summary by Category |
The Summary by Category report aggregates performance, holdings, and transactions data to provide details about how an account or group achieved the reported returns at the category level. |
X | X |
| Tax Planning Report |
The tax planning version of the Comparative Review PDF report presents account- and group-level data including long- and short-term capital gains and losses and realized gains and losses, federal and state taxable dividends and interest, and more for a given date period. |
X | |
| Holdings Reports | |||
| Amortization and Accretion |
This new report displays the amount that each fixed income or mortgage-backed security has amortized or accreted over a specified period of time, and provides the necessary year-end fixed income tax reporting. |
X | X |
| Asset Allocation |
The Asset Allocation report presents a pie chart view of an account’s assets with a legend that displays the actual percentages for each group. The chart is interactive. You can choose from four different grouping levels for the display. |
X | X |
| Bond Analysis |
This report includes the option to list all fixed income securities with the yield to maturity and modified duration, at cost and at market value. |
X | X |
| Committed Capital |
If a client has committed capital to a venture capital fund, the client will generally need to make contributions over three to five years to satisfy the terms of the agreement. You can now track the payment information in Advisor View on the new Committed Capital report. |
X | X |
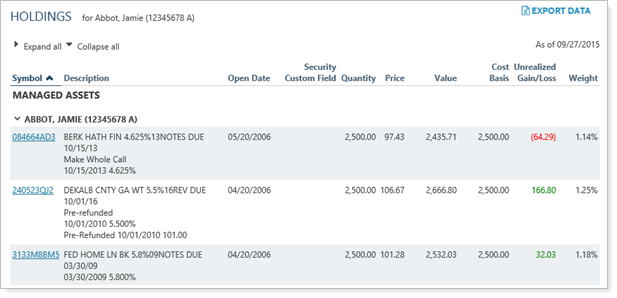
| Holdings |
The Holdings report displays all the holdings in an account, including up to three different grouping levels with subtotals. You can choose which columns to display and their order in the report. You can also set custom column widths for this report and preview it to determine if the data fits as expected. |
X | X |
| Holdings by Account |
The Holdings by Account report allows you to compare an account's asset allocations for a reporting group, and you can view accounts as columns in order to see holdings across multiple accounts. You can choose whether to view values, weight, or both. |
X | |
| Maturity Schedule |
The Maturity Schedule report displays all securities with upcoming maturities for a specified date range. You can choose which types of fixed income will display in the report. If a selected date range will cover multiple maturity periods, Advisor View will group the securities by maturity. |
X | |
| Security Cross-Reference |
The Security Cross-Reference Report lists all accounts that hold one or more securities that you specify (as of the current trade date). |
X | X |
| Unrealized Gains & Losses |
The Unrealized Gains and Losses report is a transactional report that shows all unrealized gain/loss transactions in the account over a specified period. |
X | X |
| Transaction Reports | |||
| Capital Flows |
The Capital Flows report displays all capital flow transactions over a specified time period for the account. You have the option to filter these flows by either a dollar range or percentage of the account value. You can also choose to show an Account Value vs. Net Investment chart for a specified time period. |
X | X |
| Income & Expenses |
The Income and Expenses report provides a consolidated view of income and expenses for your client portfolios. |
X | X |
| Projected Income |
This report provides data on expected income from dividends, principal repayments, and coupons. |
X | X |
| Realized Gains & Losses |
The Realized Gains and Losses report is a transactional report that shows all realized gain/loss transactions in the account over a specified period. |
X | X |
| Recent Trades |
The Recent Trades report provides a summary of all trades that were executed for the time period specified. |
X | |
| Transactions |
The Transactions report displays the transactions for an account over a specified period. You can set custom column widths for this report and preview it to determine if the data fits as expected. |
X | X |
| PDF-Specific Reports | |||
| Custom |
Use the Custom section to add additional custom content for your clients, such as a personal letter, relevant article, envelope insert pages, or cover page. |
X | |
| Dashboard |
The Dashboard report section allows you to present a custom configuration of two, three, or four data sets on a single page. |
X | |
| Table of Contents |
This section adds a table of contents based on the sections you've added to report. The title given to this section will be displayed at the top of the page. |
X | |
| Billing Reports | |||
| Billing |
This section creates a billing statement for the client. |
X | |
| Billing History |
The Billing History report shows the time periods, adjustments, paid amounts, and billing amounts for each portfolio. This report is available as a dynamic report only. |
X | |
| Business Intelligence Reports | |||
| Firm Revenue |
The Revenue report shows the total revenue received by the firm and breaks that down by advisor, to show how much revenue each advisor brought in for a designated time period. |
X | |
| Utilization |
The Utilization report shows Tamarac usage statistics such as number of Households, clients, portal usage, document vault usage, and more. |
X | |
| Compliance ADV Report |
The Compliance ADV report shows general information about your client relationships to help you fill out Form ADV. Examples of this information include the number and value of accounts by client type, custodian, wrap program, and more. |
X | |
| Financial Planning Reports | |||
| Financial Plan Summary |
If you use the MoneyGuide integration, you can see the MoneyGuide Financial Plan Summary as a dynamic report within Tamarac for a quick review of a client's financial plan. |
X | |
| Net Worth |
With the Net Worth report, you can see a client's complete financial picture in one place. The Net Worth report combines assets and liabilities—whether entered manually or via Envestnet | Yodlee integration—with other holdings information to allow you to tell the complete financial story of your clients. |
X | X |
| Relationship Diagram |
The relationship diagram shows how accounts, groups, and Households are connected with each other by displaying connections in a visual tree structure. Learn More >> |
X | |
Run Reports
For more information on running reports and the difference between dynamic and PDF reports, see Running Dynamic and PDF Reports.
Run a Report
To run a dynamic report:
-
On the Reports menu, click the report you want to view. The report will appear on your screen.
-
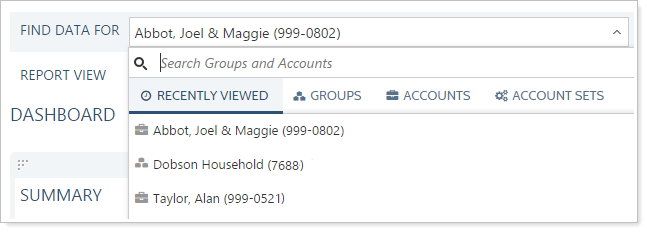
Use the Find Data For list to select the record you want to run the report on.
-
In the Find Data For list, choose the record that you want to run the report on. The 250 most recently viewed records are displayed. You can click on the tabs to filter them by type.
-
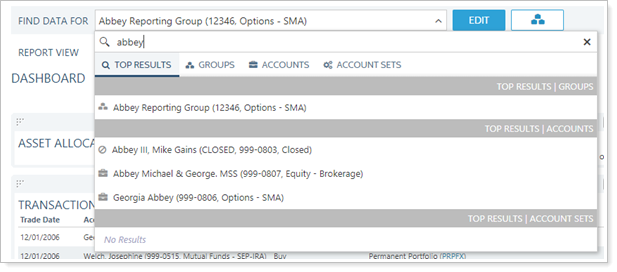
If you know the name or number of the account, group, Household, or account set you want to run the report on, type it in the Search Groups and Accounts box. The search dynamically updates, refining results as you continue typing.
-
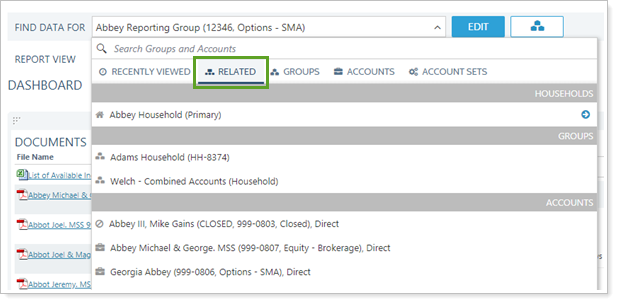
If you want to view a record for accounts, groups, or Households related to the current search, click the Related tab. Select the desired record.
-
If you want to view the report for all accounts, in the Find Data For list, search for All Accounts.
-
-
From the Report View list, choose the view you want to use.
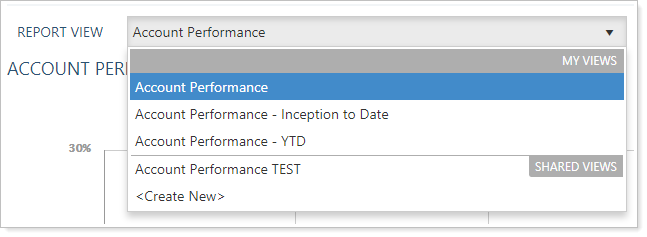
You can change the report view at any time while still seeing the same account or group by choosing a new view from the Report View list. For more information on creating report views, see Dynamic Report Views.
Generate a PDF Report
You can generate a PDF performance report from within Advisor View. To run the report, you must first create a PDF report template.
For information specifically regarding running a report on a Household or account, see Running Dynamic and PDF Reports.
To generate a PDF report:
-
Click Accounts on the menu bar.
-
Do one of the following:
-
In the Find Data For list, choose the record that you want to run the report on. The 250 most recently viewed records are displayed. You can click on the tabs to filter them by type.
-
If you know the name or number of the account, group, Household, or account set you want to run the report on, type it in the Search Groups and Accounts box. The search dynamically updates, refining results as you continue typing.
-
If you want to view a record for accounts, groups, or Households related to the current search, click the Related tab. Select the desired record.
-
If you want to view the report for all accounts, in the Find Data For list, search for All Accounts.
-
-
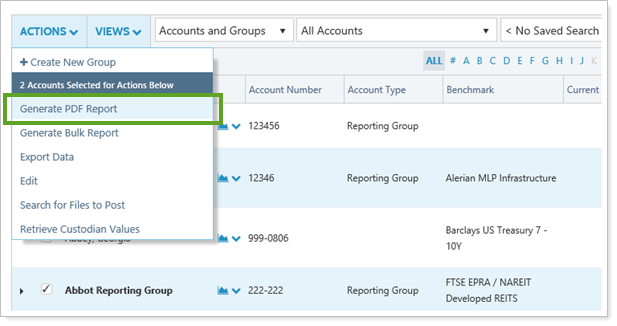
Select the one or more accounts that you want to generate a performance report for, and in the Actions list, click Generate PDF Report.
-
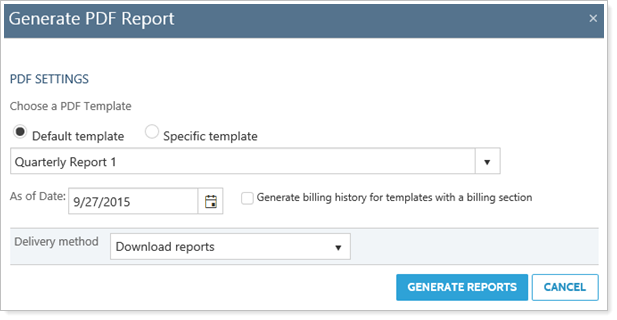
In the window that displays, choose a template for the reports you selected. You can also assign a default PDF template to each account or group and generate the default template by selecting Account Default. For more information on assigning a default template, visit Assign Default Templates Using PDF Template Types.
-
Click
 . In the calendar that appears, click an end date for the report. This date will be used on all accounts and households you selected.
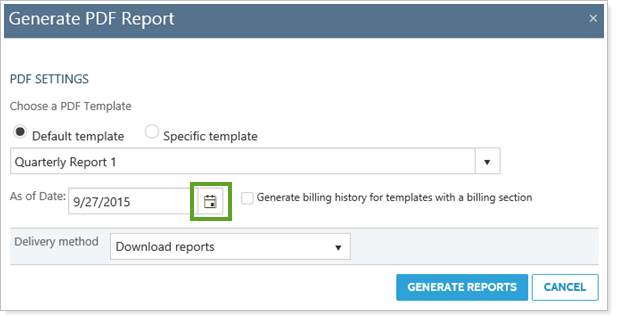
-
In the Delivery method list, click Download Reports. If you want to learn how to post PDF reports to a client portal, visit Post a PDF Report to a Client Portal. For more information on setting the default delivery method for each client, visit Assign a Default Report Delivery Method.
-
Click Generate Reports. If you generated only a report for only one account, the report will appear on your screen. If you generated a report for more than one account, a banner reminds you to go to the PDF Report Status page to view the reports.
-
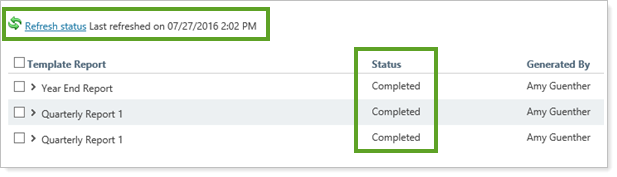
On the PDF Report Status page, Completed will appear in the Status column when Advisor View is finished generating the reports. If you selected a large number of accounts, processing may take a few minutes. If Advisor View is not finished generating the report, Processing will appear in the Status column. To update the status of the report, click the Refresh Status link at the top of the page.
-
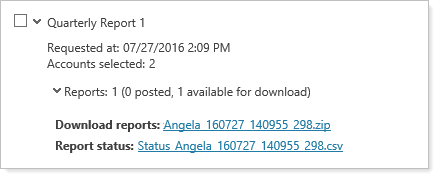
When the Status column changes to Completed, click > next to the report you want to view and then next to Reports.
-
Click the link next to Download reports. If you are generating a report for more than one account, Advisor View will create a ZIP file that contains the reports you generated.
-
If you generated reports for more than one account, in the window that opens, choose a location to save the ZIP file, and then click Save. When the download is complete, double-click the file you saved.
-
Double-click the report file you want to view, and a PDF report appears on your screen. You need Adobe Reader or Adobe Acrobat to view the reports.