
Contents

How Show Risk Measurements Works
| Applies to: | ||
|---|---|---|
| ✔ Dynamic |
✔ Client Portal |
|
This setting allows you to show or hide the risk measurements table on the Account Analytics report. The table summarizes the following risk statistics:
You would use the relative statistics table if you want to provide your clients with the data points that go into calculating risk measurements. Useful statistics might vary depending on your strategy. For example, you may want to show your investments' return and standard deviation in comparison with a benchmark. This table is good for a financially savvy clients who want to know details, or for internal firm evaluations.

In Dynamic Reports
-
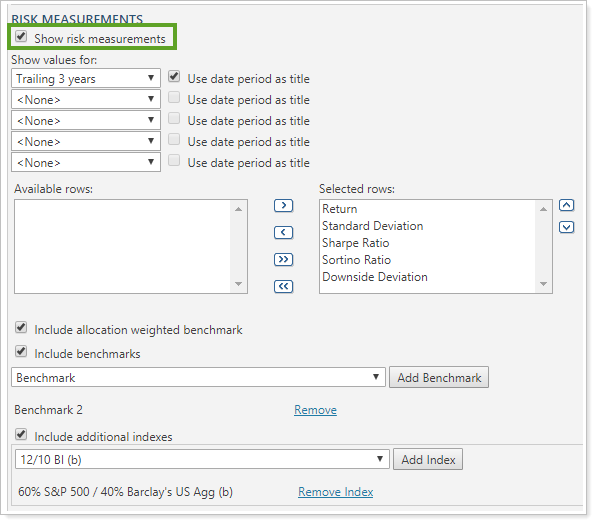
To show the risk measurements table, select the Show risk measurements check box. All related report settings for the Risk Measurement section appear below the chart.
-
To hide the risk measurements table, clear the Show risk measurements check box. All related report settings are hidden and the section will not appear on the report.
When you select the Show risk measurements check box, the following additional settings appear:
| Setting | Report Output |
|---|---|
| Show risk measurements cleared |

The Risk Measurements section is hidden. Only the Risk vs. Return chart and the Relative Statistics table are shown. |
| Show risk measurements selected |
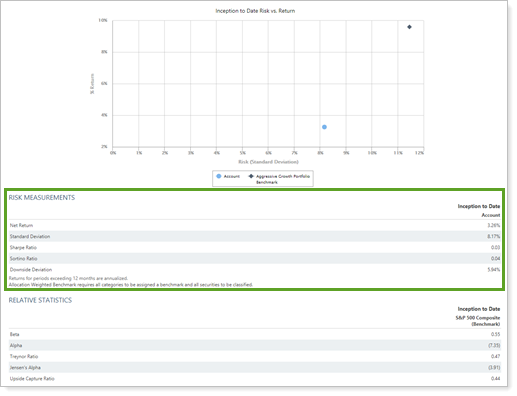
The Risk Measurements section is displayed between the Risk vs. Return chart and the Relative Statistics table. |
In PDF Reports
Full PDF Report Section
Functionality is the same in the PDF report templates as in dynamic reports.
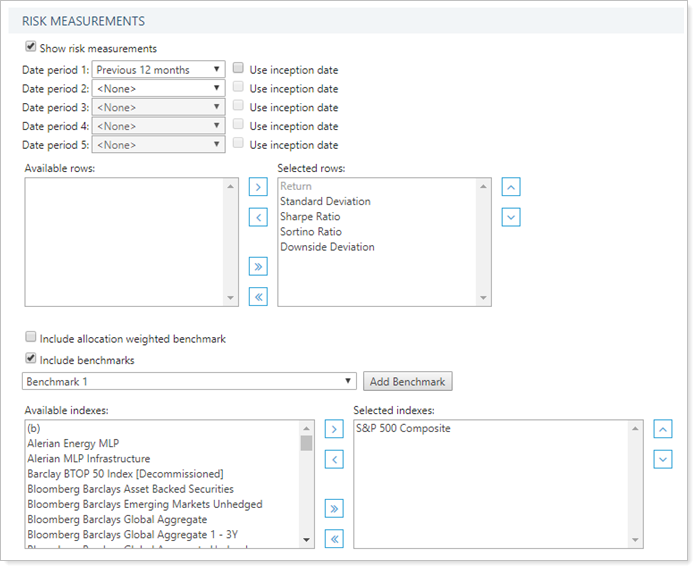
When you select the Show risk measurements check box on the Account Analytics report, the following settings appear:
PDF Dashboard Section
When you add the Account Analytics report to one of the PDF Dashboard panels, you can choose to add one of the three Account Analytics sections to the panel. The options are:
-
Risk vs Return Scatter Plot
-
Risk Measurements
-
Relative Statistics
For more information about the risk vs. return chart or relative statistics, see Show Risk vs. Return Chart and Show Relative Statistics.
-
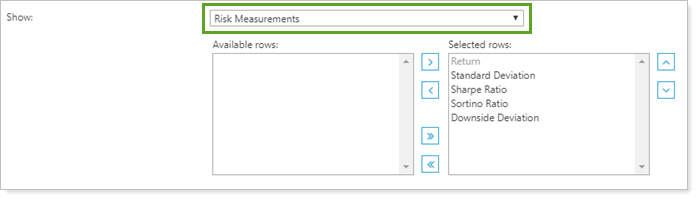
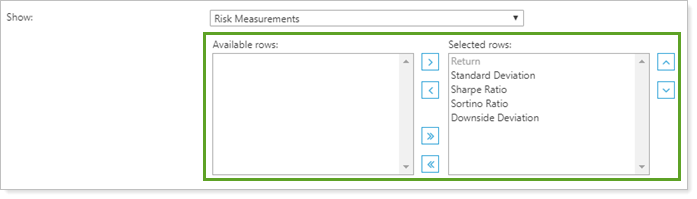
To add the risk measurements table to the PDF Dashboard panel, click Risk Measurements in the Show list.

Available/Selected Rows
When you show the risk measurements table in the PDF Dashboard, the Available/Selected rows list allows you to control what statistics the report displays.
For more information about using available/selected rows, see Available/Selected Columns.
Reports With This Setting
Performance Reports
|
|
PDF-Specific Reports
Related Settings
For more information about date periods, see Dates and Date Periods. For more information about themes, see Site Themes and PDF Themes.