 Back
Back Home > Advisor View > Reports > Dynamic and PDF Reports > Available Reports > Performance Reports > Performance Attribution Report
|
Back |
Home > Advisor View > Reports > Dynamic and PDF Reports > Available Reports > Performance Reports > Performance Attribution Report
|
Performance Attribution Report
|
|
| Applies to: | |||
|---|---|---|---|
| Dynamic | Mobile | Client Portal | |
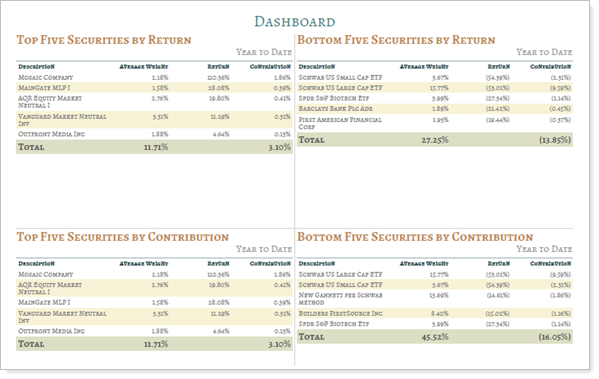
The Performance Attribution report is a report only available on the PDF Dashboard section that lets you sort securities or security categories by the performance measures of return, contribution, and average weight. This allows you to show the top or bottom securities or security categories and see how those securities contribute to performance. For example, you can show the top 5 contributing securities and use the Total row to see the combined contribution impact compared to the total portfolio.
The Performance Attribution report contains information available on the Position Performance report. The Position Performance report contains comprehensive information about the portfolio, but the Performance Attribution report lets you see more of a summary of top and bottom performers, allowing you to see how these securities contribute to overall performance and communicate this information to clients on a PDF.
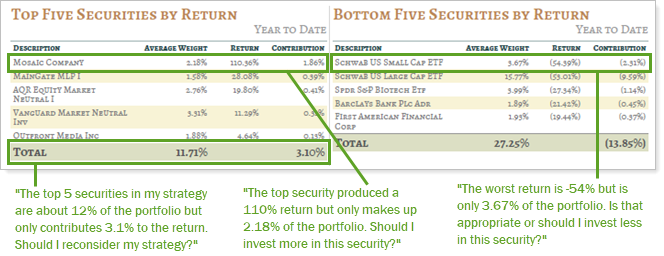
You are examining the performance of a client's portfolio and want to see how much the best and worst performing positions in that portfolio affect overall performance. You create a PDF template that includes a few versions of the Performance Attribution report to rank securities in both descending and ascending order:
You examine the highest and lowest performing securities by return. This helps you answer important questions about your strategy:
The Performance Attribution report is only available as a PDF Dashboard section. To create this report, you'll take these high-level steps:
Create a new PDF template or edit an existing one. For more information, see Create, Edit, and Delete a PDF Template.
Add the PDF Dashboard section to your template and configure the dashboard.
Click the Settings button  . This opens a window to edit the selected panel.
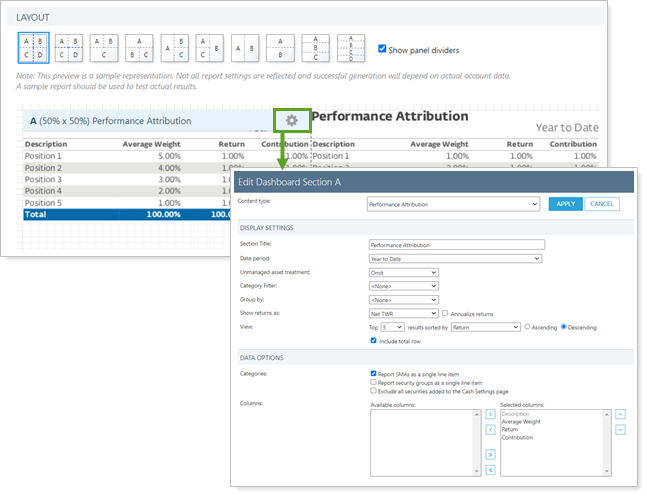
In the Content type list, select Performance Attribution.
Configure the settings. See Performance Attribution Settings for more information on individual settings.
When finished, click Apply.
Save the template.
Here is more detailed information about the individual settings available in the Performance Attribution PDF Dashboard section:
| Setting | More Information |
|---|---|
| Section Title | Designate what the section will be called in the PDF report. |
| Date Period | Select the date period you want to use for the report. |
| Unmanaged Asset Treatment | Choose how you want to treat unmanaged assets on the report. |
| Category Filter | Choose to include or exclude specific categories from the report. |
| Group By |
Choose how you want to show the rows of the report, using the following guidelines:
|
| Show Returns As Net or Gross IRR or TWR | Determine how returns should appear on the report. |
| View Top (Number) Positions, Sorted By | In the dashboard report, designate how positions are displayed. |
| Include Total Row | Select this option to show a row of totaled amounts. When cleared, you won't see a totals row. |
| Report SMAs as a Single Line Item | Choose how you want to see SMAs in the report. |
| Report Security Groups as Single Line Item | Choose how you want to see security groups in the report. |
| Exclude All Securities Added to the Cash Settings Page | Show or hide securities added to the Cash Settings page. |
| Available/Selected Columns |
Choose which columns are included and in what order, including these: |

