
Contents

How Show Section Works
| Applies to: | ||
|---|---|---|
| ✔ Dynamic |
Client Portal |
|
This setting allows you to set what Account Analytics section you want displayed as a dashboard report. You can choose to display one at a time, but it can be useful to create multiple dashboard reports, each focused at addressing specific needs.

In Dynamic Reports
You can choose to create a dashboard Account Analytics report that displays any one of the following sections:
| Setting | Report Output |
|---|---|
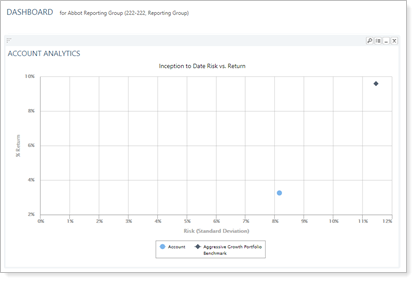
| Show section set to Risk vs. Return Scatter Plot |
The dashboard report shows the Risk vs. Reward Scatter Plot as configured in the Account Analytics report and based on the date period you set in the dashboard settings. |
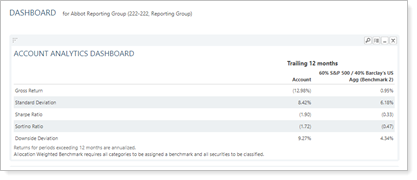
| Show section set to Risk Measurements |
The dashboard report shows the risk measurements table as configured in the Account Analytics report and based on the date period you set in the dashboard settings. |
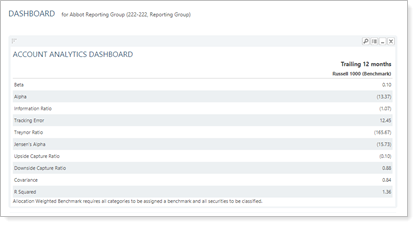
| Show section set to Relative Statistics |
The dashboard report shows the Risk vs. Reward Scatter Plot as configured in the Account Analytics report and based on the date period you set in the dashboard settings. |
In PDF Reports
This setting is not available for PDF reports.
Reports With This Setting
Performance Reports
|
|
Related Settings
For more information for creating date periods, see Date Periods.
The following settings are related to this option: