
Contents

Reporting
Enhanced Summary by Category Functionality
Last release we introduced the Summary by Category report as a powerful tool to evaluate performance at the category level. With this release, we expand the capabilities of this report by giving access to even more gain/loss data, aggregating values for assets not assigned to categories, and providing more fine-grained control of what data the report include and how they are displayed.
These changes include:
-
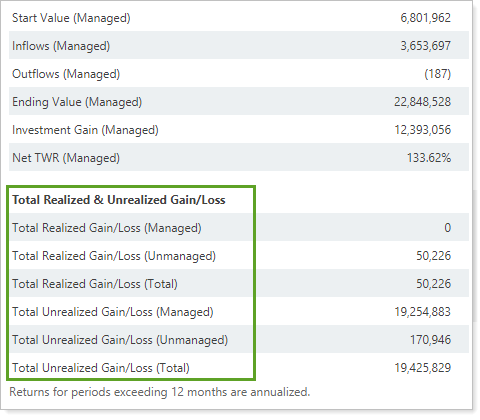
Realized and Unrealized Gain/Loss Rows. To make the report more useful, we've added short-term, long-term, and total realized and unrealized gain/loss rows as available data points. If you select Use the Account Custodian As the Source of Record for Realized Gains Losses, you'll see custodian data for realized gains and losses.
-
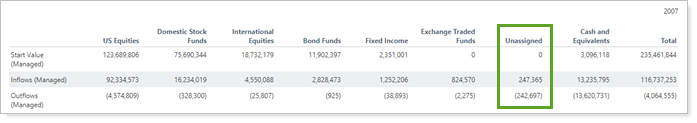
Unassigned column. We know that your firm may not have classified all your securities into every category. With this release, the report displays securities that aren't assigned to a category aggregated in the Unassigned column. This column always appears on the right after the individual category columns, before the Total column, regardless of Order by configuration.
-
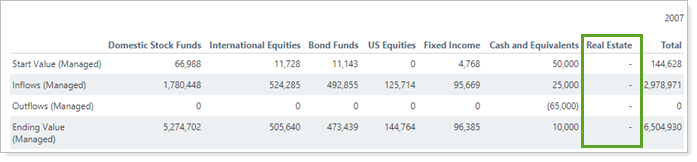
Manually Add Columns. To allow for greater consistency when you compare one account with another, you can now manually include columns for categories. For example, if you always want to see the Real Estate column, you can add that category to the report for all accounts, whether or not an individual account holds securities categorized as Real Estate.
We've also added the following settings to the Summary by Category report:
-
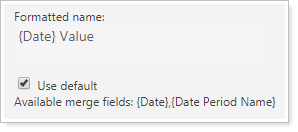
Use merge fields in custom naming forStart Value and End Value.
-
Dollar amount precision (dynamic report only)
-
Percentage amount precision (dynamic report only)

New Data Point: Yield to Worst
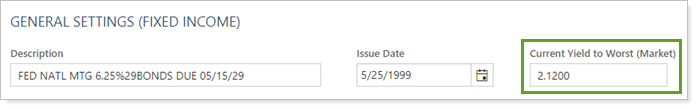
For firms that have callable bonds, we know that you make choices about suitability based in part on yield projections. To further facilitate analysis of fixed income securities, we've added another yield data point: Current Yield to Worst (Market).
> Track Yield to Worst for a Fixed Income Security
In fixed income securities, you'll see Current Yield to Worst (Market) as an available field that automatically populates through the security detail sync. You can also manually edit the value in the General Settings of a fixed income security.
Note
To update Current Yield to Worst (Market) in bulk, use a Security Information upload.
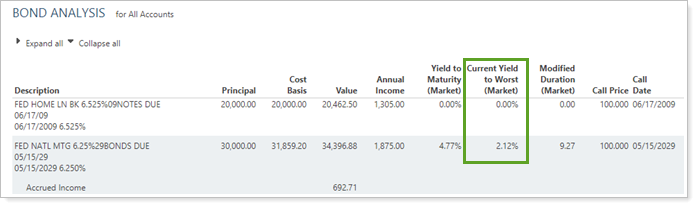
> Report on Yield to Worst
To report on Yield to Worst, you can add the new Current Yield to Worst (Market) column on the Bond Analysis dynamic and PDF report. You'll also find it in bulk reports within the Security - General section and on the client portal as a Client View data point.
Notes
-
Tamarac reports on Current Yield to Worst (Market) based on the enterprise as-of date, regardless of report date settings.
-
You won't see Current Yield to Worst (Market) included in any total rows because it only applies to each individual security.
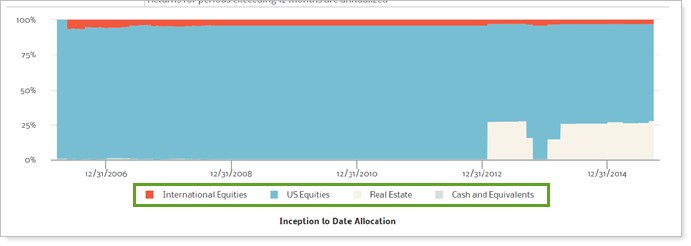
Control the Asset Allocation Over Time PDF Dashboard Report Category Sort Order
The Asset Allocation PDF dashboard report for allocation over time now joins the dynamic and full PDF report in automatically displaying categories sorted by your firm's category sort order. We've made this change based on your feedback to allow you to control the order in which the PDF dashboard displays categories.
Usability
Standardized Data labeling on Bulk Reports and Client Portal DAshboard Tiles
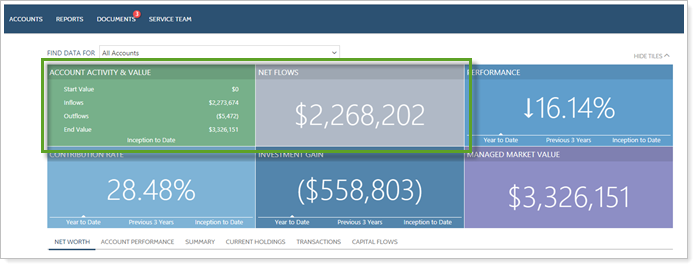
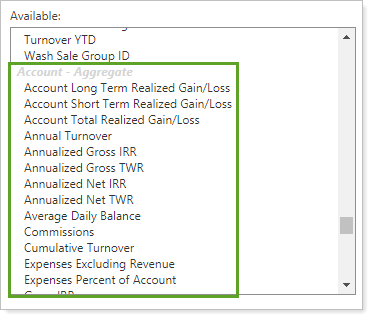
We've expanded our effort to make data labels more consistent across the board, this time including client portal dashboard tiles and the Account - Aggregate bulk report section. While results remain the same, you and your clients will find it easier to compare data across Tamarac with these standard naming conventions.
Changes include the following:
-
Client Portal Flow Reporting. Client View dashboard tiles include Inflows and Outflows, as well as Net Flows.
-
Bulk Report Returns. Returns reported in the Account - Aggregate bulk report section will be more consistent.
-
Renamed Data Points. We've renamed some of the existing data points in the available/selected list. The renamed data points are:
Feature Old Name New Name Bulk Report: Account - Aggregate
Account Net Contribution
Net Flows Account Contributions
Inflows Account Withdrawals
Outflows Client Views: Summary Data Report Tile
Net Contribution
Net Flows Contributions
Inflows Withdrawals
Outflows Client portal tiles currently using one of these columns will continue to display the existing column name. For example, if you include Net Contributions now, after the release, it will still say Net Contributions, but it will report net flows.
Note
You will also have the option to include managed, unmanaged, and total inflows and outflows.
-
Standardized meanings for Missing Return indicators. On the Account - Aggregate bulk report section and on some client portal tiles, you may have noticed that some cells indicated $0, 0%, or N/A when there were no data to report. With this release, 0 means an actual value or percentage of 0, and Tamarac always marks missing data with the following indicators:
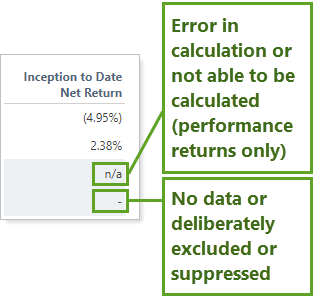
For more information, see Display Missing Returns As.
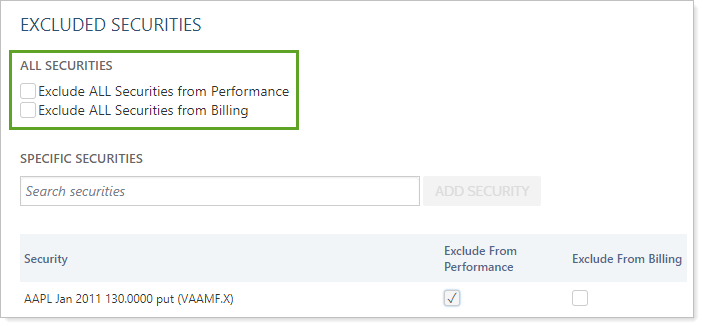
Clearer Labeling for Exclude All Securities Settings
We know that it's not always been easy to tell what happens when you select the check boxes next to Exclude From Performance and Exclude From Billing. To help make it clearer what these account settings do, we've moved and slightly renamed the check boxes to indicate that all securities within the account are excluded when you select either check box.
Note
The behavior of these check boxes hasn't changed.
Learn More - Watch the Release Video