Contents
Reporting
Holdings Report Updates for Filtering, Sort Order, Unmanaged Assets Options & Columns
We have added new features to the Holdings report—we've expanded your filtering options, added the ability to set a default sort order, allowed you to include or exclude unmanaged assets in the Dashboard section for PDF Templates, and provided new columns. We also added real time pricing.
> Multiple Filtering Levels
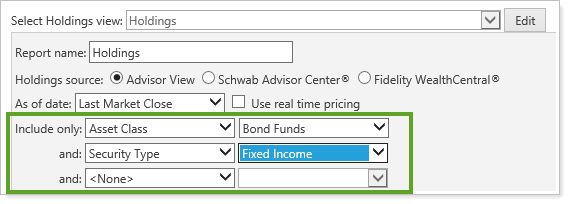
You can now filter by multiple levels on the dynamic Holdings report and in the Holdings section of the PDF Template. For instance, instead of seeing all of your Asset Class holdings, you can now narrow what's included to just the Asset Class holdings for Fixed Income, and you can add additional filtering beyond that, as needed.
> Set Default Sort Order
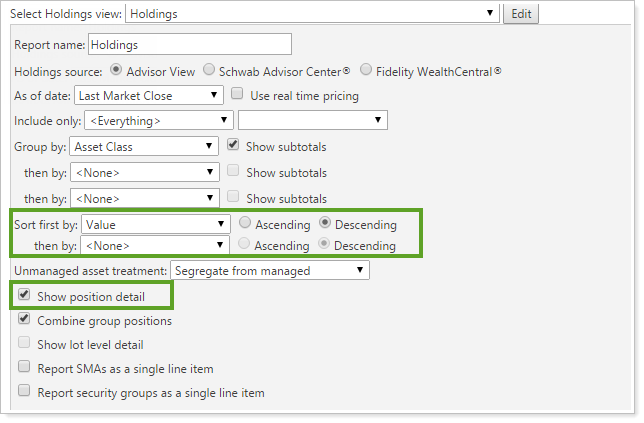
You can determine the default sort order for all holdings in the Holdings report, allowing you to rank them by market value and more. We added multiple levels of filtering for the dynamic report and the PDF templates, and you can set whether they're sorted in ascending or descending order. The lists allow you to choose from any of the report's existing columns, such as Value, shown below.
> Include Unmanaged Assets In PDF Dashboard section
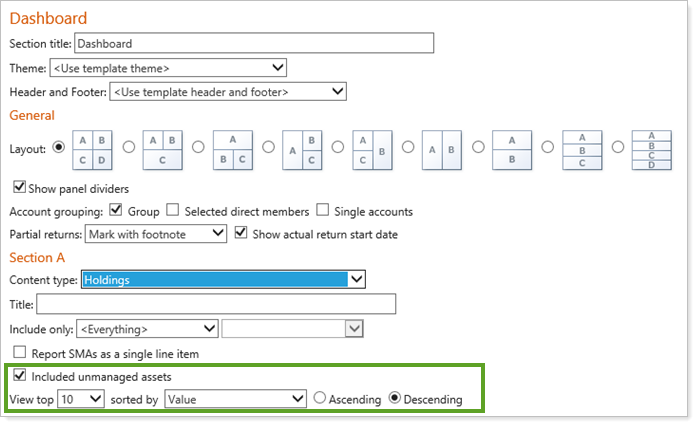
You can choose whether to include unmanaged assets in the Dashboard section for PDF Templates. By default, the Include unmanaged assets check box is selected for the Holdings content type in the Dashboard section.
> New Columns available
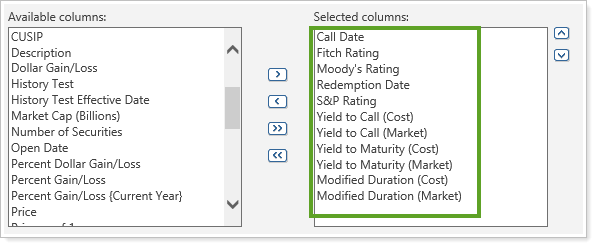
You can include many new columns for this report—and they have a history of ratings that reflect the "as of" date (except where noted). The new columns are:
-
Call Date (does not use "as-of" date)
-
Fitch Rating
-
Moody's Rating
-
Redemption Date (does not use "as-of" date)
-
S&P Rating
-
Yield to Call (Cost)
-
Yield to Call (Market)
-
Yield to Maturity (Cost)
-
Yield to Maturity (Market)
-
Modified Duration (Cost)
-
Modified Duration (Market)
Frozen Headers for Dynamic Reports 
Previously, when you were viewing dynamic reports and scrolling down to view entries lower on the page, your column headers in the top row would disappear. When you're working with a worksheet that has many rows and columns, Advisor View will now keep column headings always visible on the screen as you scroll down through the rows. This allows you to maintain context when you scroll to data at the bottom of the page, and reduces uncertainty about which data you are viewing.

Set the Custodian as the Source of Realized Gains/Losses
In some rare cases, such as after a cost basis reset, the custodian may have more accurate cost basis than Advisor View. To accommodate these types of scenarios, Advisor View now has an option to use the custodian as the source for cost basis on the Realized Gains/Losses report.
After this release, Advisor View can look to the account custodian file for the cost basis. You can add the new Source of Record column to see if the custodian file was used.
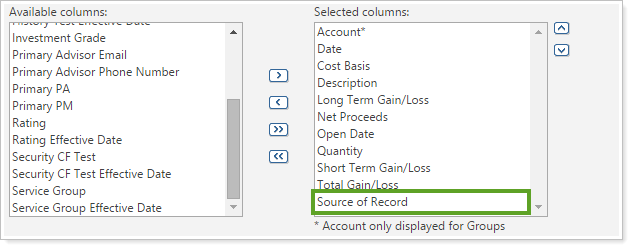
The setting is set at the account level, so you can choose which accounts use the custodian file and which use the data that’s in Advisor View. If you maintain your accounts and groups in Advisor View, you can enable the option by selecting the new check box on the Reporting page of the Edit Accounts dialog.
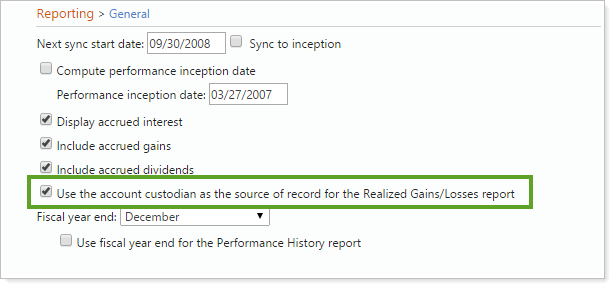
As of this release, this feature is only available for accounts custodied at Schwab and for firms using Tamarac Advisor Services. For more information on enabling this functionality at your firm, please contact your Tamarac Advisor Services representative.
Target Minimums and Maximums Added to Asset Allocation Reports
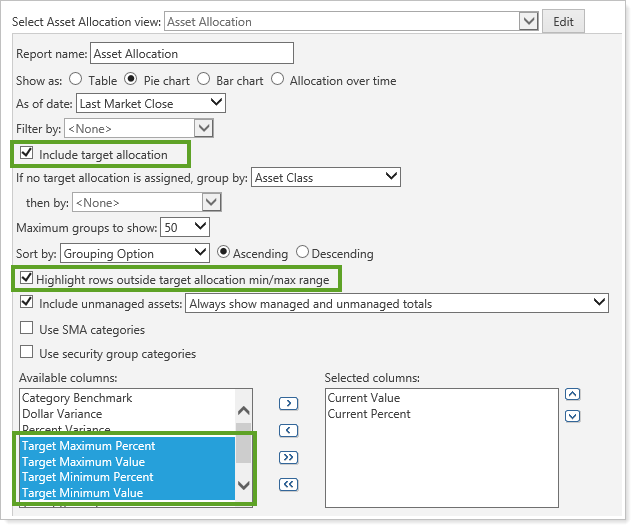
For your Asset Allocation reports, you now you have complete control over which columns are included in your report and what order the columns are in.
We've also added new columns so that you can track target minimums and maximums when you include target allocation on the Asset Allocation report. The new columns are:
-
Target Max Value
-
Target Min Value
-
Target Max Percent
-
Target Min Percent
These columns are available for the full dynamic report, the full PDF report, the dynamic PDF dashboard and the dynamic dashboard if you've selected the Include target allocation check box.
You can also choose whether to highlight rows with an asterisk if they're outside the target min/max range. If there are rows that are out of tolerance, a footnote at the bottom of the report displays this message: Categories marked with an asterisk (*) are outside the target allocation min/max range. This option is only enabled if you selected the Include target allocation check box.
Hide or Show Date Periods on the Capital Flows Report
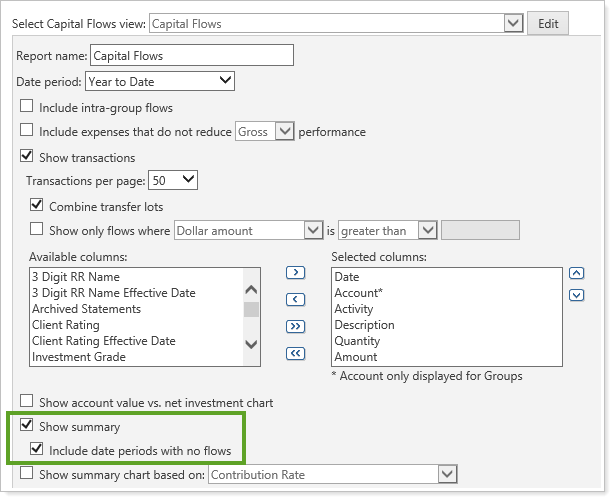
On the Capital Flows report, you can show or hide date periods where there were no contributions or withdrawals. This option ensures that clients see only the data you want them to see, and it's available for the PDF report, dynamic report, and dashboard summary.
If you select the Include date periods with no flows check box when you edit the Capital Flows report, clients will see any applicable date periods as $0 for contributions and withdrawals if there were no flows in the summary. If you clear this check box, they will be omitted from the summary. With this release, all PDF reports will have this check box selected by default, and dynamic reports will have it cleared. The option is only enabled when the Show summary check box is selected.
Renamed Gain/Loss Columns for PDF Templates
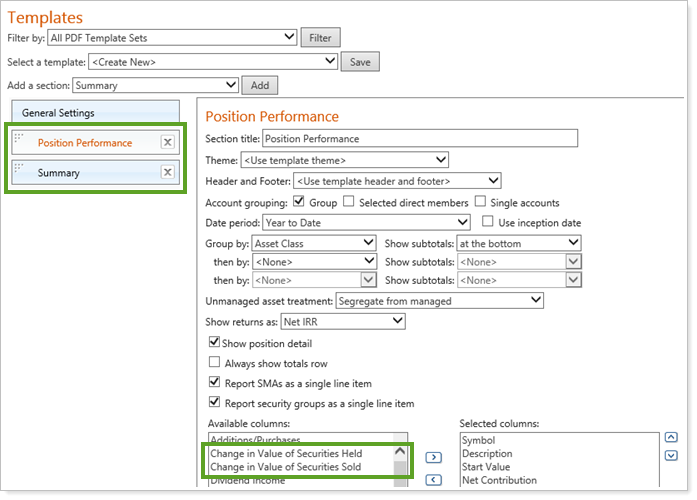
To reduce confusion and help you show detailed performance of positions, we have renamed columns in the Position Performance and Summary sections for PDF Templates:
| Old Column Name | New Column Name |
|---|---|
| Unrealized Gain/Loss | Change in Value of Securities Held |
| Realized Gain/Loss | Change in Value of Securities Sold |
Horizontal Scrolling on the Dynamic Realized Gains/Losses Report
When you generate a dynamic Realized Gains/Losses report with many columns, some columns may not fit visibly on the page. Advisor View will now allow horizontal scrolling, so you can easily see all columns.

PDF Reporting
New PDF Report Allows You to Track Performance History 
important
This feature will become available on February 12th.
We know how valuable it is to track the performance of your accounts over time, so we have built a new PDF report called Performance History. You’ll now be able to compare performance for an account or group with multiple date periods and categories (such as asset classes). For example, you can look in the Net Investment Gain column to see what that value was for each month. Or you could compare the end value for each quarter in order to identify performance patterns.
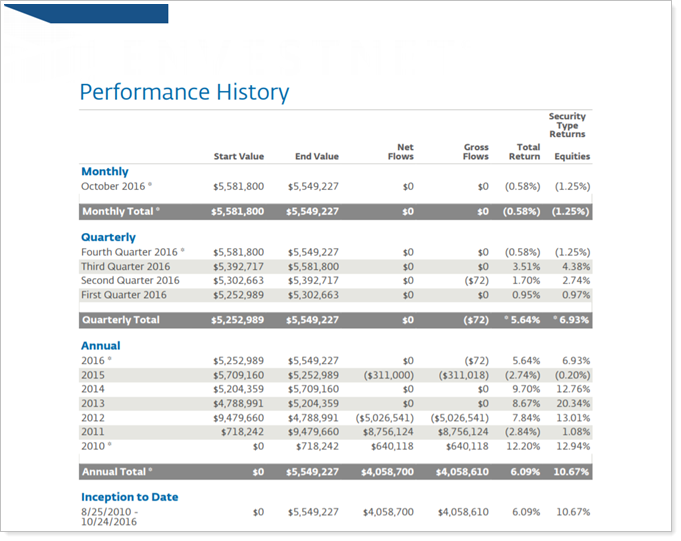
If you want to compare the account performance against your benchmarks or against additional indexes, you can add those to the report as well, making it easy to see all the data in one place.
There are many ways you can customize this report. You can set:
-
Report periods
-
Grouping
-
The way returns are shown
-
Precision for dollar and percentage amounts
You can also select:
-
Columns
-
Theme
-
Header and footer
We provided a new option to base date periods on the fiscal year end date for the account. You can also base your date periods on the calendar year or on the account setting instead if you prefer.
Restrict PDF Report Status to an Advisor's Own Reports
We have given you more control over what advisors can access by adding a new delete permission for the PDF Report Status page. Previously, advisors were allowed to delete any report status. We have renamed this permission and it is now called Delete report status generated by any advisor. In addition, we have created a permission that limits advisors' delete permissions to only the report statuses they have created themselves. This new permission is named Delete report status generated only by advisor.
You can set these permissions on the User Management page when you manage roles.
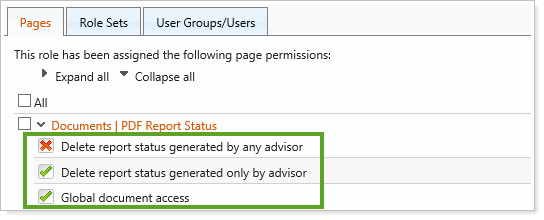
To compliment these stricter permissions, we’ve also created a new permission for Global Document Access. When advisors have this permission, they can then either view the status for all reports, or just the reports they have generated. When advisors do not have this permission, they will only be able to view the PDF reports that they have generated from the Accounts page.

PDF Reports Use Column Space More Effectively for the Account Ledger
We have adjusted the column widths for PDF reports to minimize extra space and use the available space as efficiently as possible on the Account Ledger PDF section. This should reduce many of the rendering errors that can occur when generating PDF reports.
Bulk Reports
View All Exclusions on Account Excluded Securities Bulk Report
By default, both global and account level security exclusions are shown in your Account Excluded Securities bulk report. Now you can choose whether global options are included, or whether only the account level exclusions are shown. To set this option, select or clear the new Include global exclusions check box on the Set Additional Options tab of the Edit Bulk Report page.
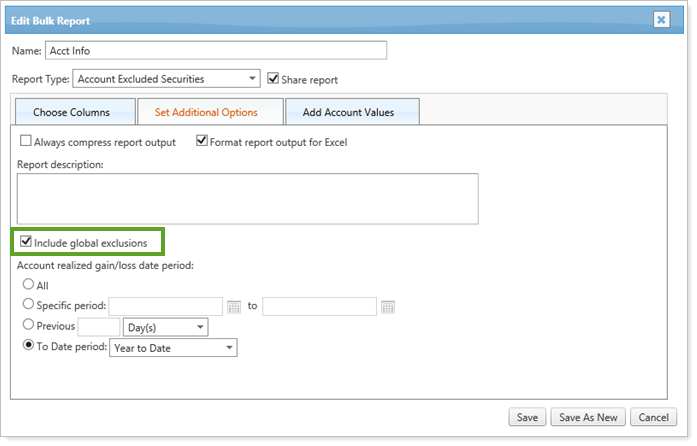
For consistency, we have also updated this report so it no longer shows the Globally Exclude from Billing or Globally Exclude from Performance columns. Those columns are now only on the Security Information bulk report.
Realized Gains/Losses Available in the Account Information Bulk Report
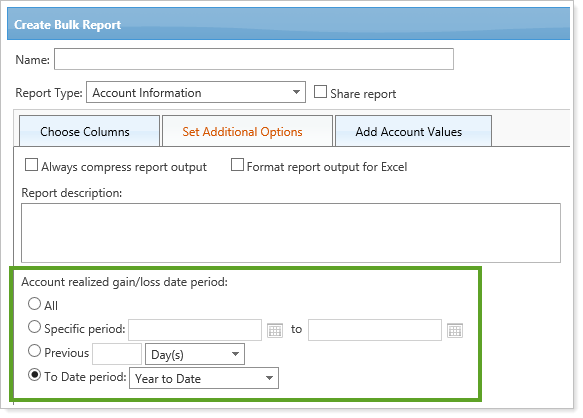
We have provided you with more options for tracking gains and losses on the Account Information bulk report. When you create this bulk report, you can set a date period for your realized gain/loss values on the Set Additional Options tab, and include the following new columns:
-
Account Short-Term Realized Gain/Loss
-
Account Long-Term Realized Gain/Loss
-
Account Total Realized Gain/Loss
Security Bulk Report Columns Renamed
To reduce confusion and ensure there are no duplicate column names, we’ve updated the names of some of our bulk report columns. With this in mind, the following columns were renamed in the Security section of all security-related bulk reports:
| Old Column Name | New Column Name |
|---|---|
| Benchmark | Security Benchmark |
| Annual Income | Security Annual Income |
Removed Redundancy of Columns for Billing History Bulk Reports
Since the Proration Amount column was updated last release, we have removed the Capital Flow Adjustment column from new and existing Billing History bulk reports to prevent confusion and increase consistency across your reports.
Account Maintenance
Updated Accounts Page Loads Faster and Allows Faster Searches 
The Accounts page is central to many tasks in Advisor View, so we have updated it to provide you with better functionality. You will notice that the Accounts page loads quickly now, and we expect the increased speed to save you both time and frustration. You don't have to wait for the full page to load—each account loads as it is ready and calculated data loads progressively to minimize delays.
You can also find your accounts faster with the alphabetical links we added at the top of the page, or with the numbered page links at the bottom of the page if you don’t know the name of the account.
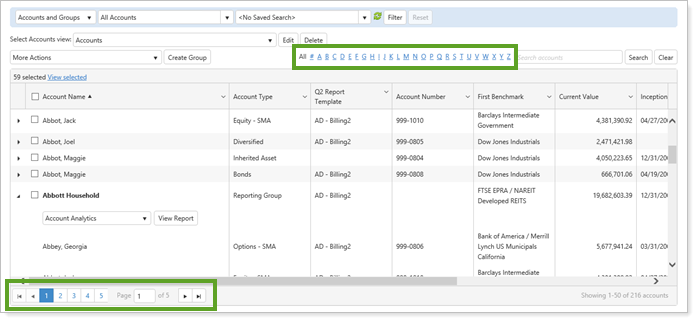
If you use a saved search to find an account, you now have control over when the search begins processing. It will now start only when you click the Filter button, instead of running immediately.

We have frozen the column headings as well, so that you don’t have to remember which data belongs to which column as you scroll down.
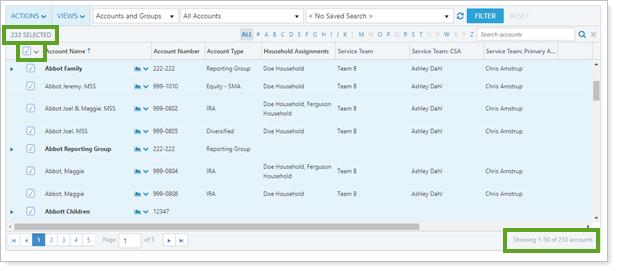
You will notice that there are three locations on the screen that indicate how many of the accounts you’re seeing on the screen, and how many total accounts are selected. You can easily see which accounts you’ve selected by clicking the View selected link.
If you click the check box in the header row, you will select all accounts on the page—not all accounts within Advisor View. To select all accounts that are returned from your current filters, click the link on the right side of the page that lists the number of total accounts.
Add or Upload Fiscal Year End Date for Accounts and Groups
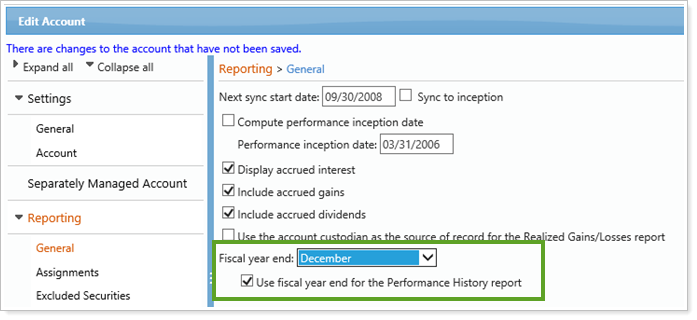
You can use the fiscal year end date for the categorization on the Performance History PDF report. This option is available for each account, and you can select it in the Edit Account window. You will be able to set the fiscal year end month, then select the Use fiscal year end for the Performance History report check box. You will not see fiscal year mentioned on the report, but the quarterly and annual date periods will be adjusted to match your fiscal year.
You can also upload the data for fiscal year by entering a date in the Fiscal Year End column of your data set, and typing yes in the Year End Date Use For Reporting column.
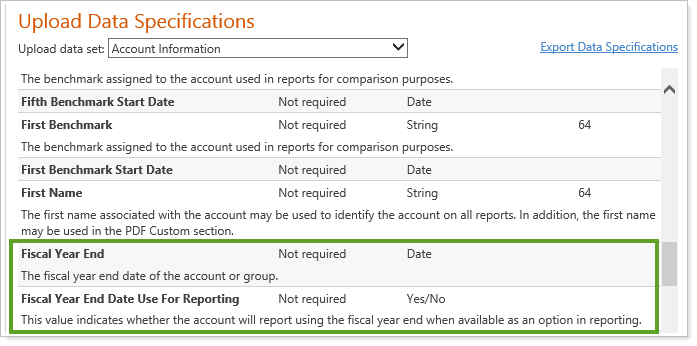
These new values are also available in any bulk report that includes account information.
Reconciliation Date and Status Available for Bulk Reports, Accounts Page and Saved Searches
For single accounts, you can now view reconciliation date and reconciliation status in the Account Information bulk report, and these columns are also available on the Accounts page when you click Edit. The last reconciliation date shows the last date a position reconciliation was performed on the account, and the reconciliation status shows whether an account is currently reconciled, force published, unreconciled or missing.
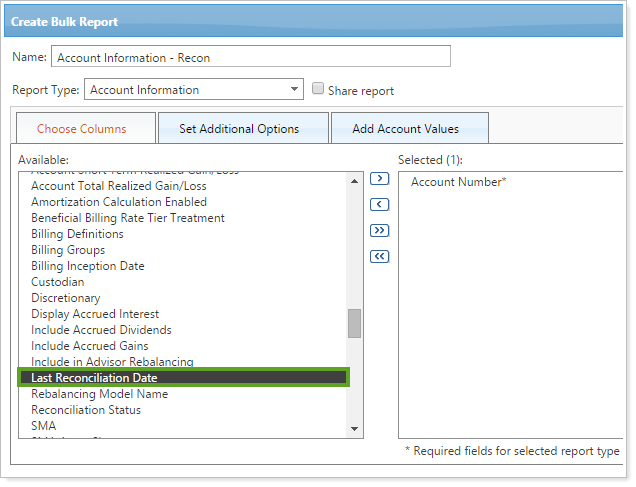
We also added two new search filters to your saved search options:
-
Last Reconciliation Date. Allows you to search within a date range.
-
Reconciliation Status. Allows you to search by whether an account is or is not currently reconciled, unreconciled, force published, manual, or missing.

New Columns for Template Types on Accounts Page
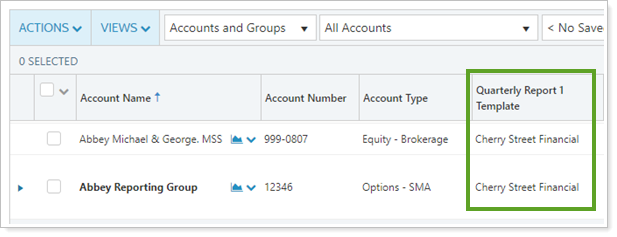
In the November release of Advisor View, we delivered template types, which allow you to create more than one default template. With this release, we've updated the Accounts page so that you can see the default templates assigned to your accounts and reporting groups. Each Template Type will appear as an available column for the Accounts page and you can choose which ones you want to see on the page. Note that in this list, each template type will have "Template" at the end of the name, even if that isn't part of the name you used for your template type. For example, if you had template types named "Q2 Report" and "Annual Report Template" they would both end in "Template", as shown below:
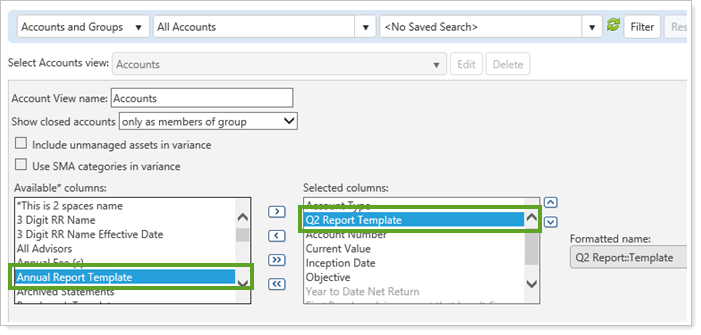
Once you've added the columns, you can see who has an assigned template, making it fast and easy to determine whether you need to make assignment changes.
Billing
Hide Adjusted Rate on Billing Statements
You can now hide the Adjusted Rate on billing statements so clients won't see a calculation that may confuse them. This is especially helpful when a Reporting Group contains only a subset of the Billing Group’s accounts and a PDF is generated from the Reporting Group.
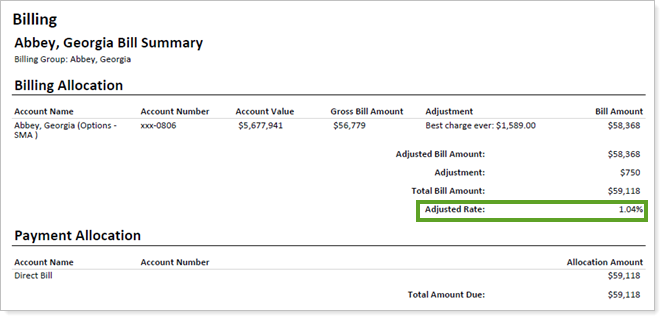
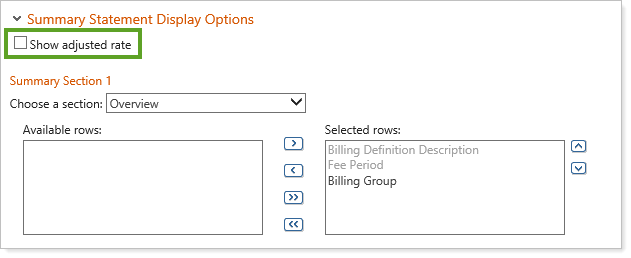
To hide your adjusted rate, clear the Show adjusted rate check box in the Summary Statement Display Options section of the Billing PDF template section.
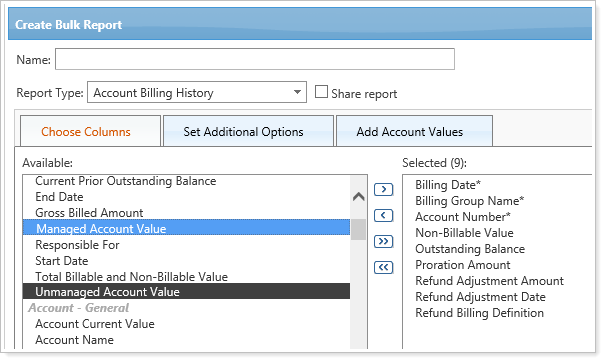
Managed and Unmanaged Account Values are Available on Billing Statements
We added the option to track managed and unmanaged account values on your billing statements. You will see two new columns for the billing definition level and the individual account level:
-
Managed Account Values. Displays the total managed account value of the underlying accounts within the billing definition.
-
Unmanaged Account Values. Displays the total unmanaged account value of the underlying accounts within the billing definition (unmanaged is defined as unmanaged for performance).
To select these columns, go to the Billing section in PDF Templates, expand Detail Statement Display Options or Summary Statement Display Options, then select the Billing Definition or Billing Allocation section.

You can also add these columns when you create the Account Billing History bulk report, and you can make later adjustments, if needed, on the Edit Bulk Report page.
Outstanding Balance Available for Billing Statements, Bulk Reports, and Upload
You can include outstanding balances on clients' billing statements now so that you can notify them of any overdue payments—and you can track these balances on two new bulk reports.

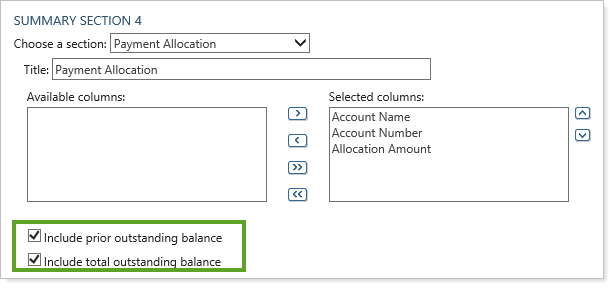
To include the prior outstanding balance and total outstanding balance on your billing statements, go to the Detail Statement Display Options section on the Billing PDF template and add a Payment Allocation section. Then select the Include prior outstanding balance and Include total outstanding balance check boxes.
You can also see outstanding balances on the Account Billing History bulk report if you add the Current Prior Outstanding Balance column, and we've added two new bulk reports on the Create Bulk Report page that help you view and track payment information:
-
Billing Payment Details. This report type is used to display whether a payment has been fully paid, partially paid or unpaid per billing date.
-
Billing Prior Outstanding balance. This report type is used to display the current prior outstanding balance per account and billing group.
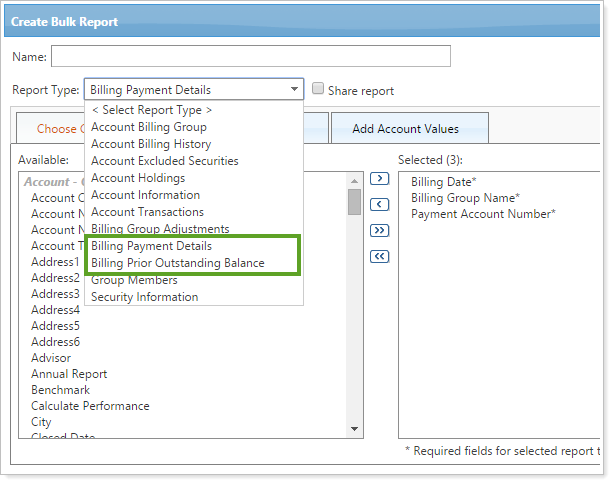
To set the outstanding balance data, you can upload this data by selecting either Billing Prior Outstanding Balance or Billing Payment Details from the Add an upload data set list on the Upload page.
Removed Redundancy of Columns for Billing History Bulk Reports
Since the Proration Amount column was updated last release, we have removed the Capital Flow Adjustment column from new and existing Billing History bulk reports to prevent confusion and increase consistency across your reports.
Client Portal
New Email Custom Signature Option for Merge Fields
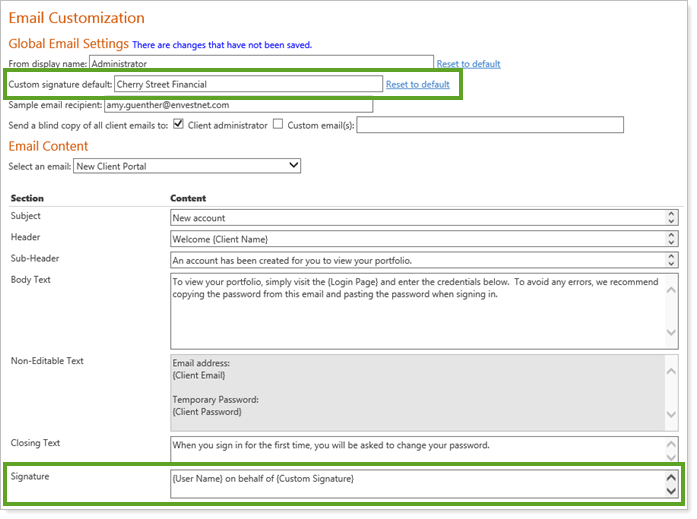
You can create custom signatures for your emails so that all automatic emails are clearly identified as coming from your firm (for example: UserName on behalf of YourFirm). This prevents confusion when clients receive emails from an employee they are unfamiliar with, and ensures that clients know the emails are valid. You can also use this merge field to identify your subsidiary company if you are part of a parent company.
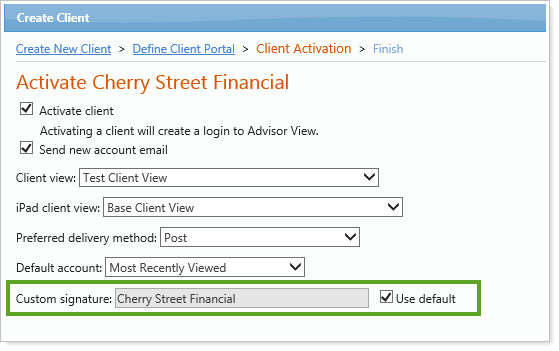
When you create your signature on the Email Customization page, you will need to add a Custom Signature merge field in addition to the User Name merge field (previously called the Advisor Name merge field). You can set the default custom signature on the same page in the Global Email Settings section.
The default custom signature is then available when you create a client. You can select the Use default check box at the end of the Create Client wizard (and you will be able to change this signature later on the Edit Client screen, if needed).
Blind Copy Email Option Added for Emails Sent to Clients
For compliance and auditing reasons, many of you have asked for the ability to receive copies of all emails generated from Advisor View to your clients. With this release, we have updated the Email settings so that you can now send a blind copy of client emails to either the client administrator or a recipient that you determine. To access this option, click Email from the Setup menu.

Customize Automatic Email "From" Addresses
Automatic emails, such as password reset emails, now don't have to be from noreply@tamaracinc.com. Because branding is a key marketing tool, you can now customize the automatic emails sent from Advisor View by requesting that they show a different "from" domain.
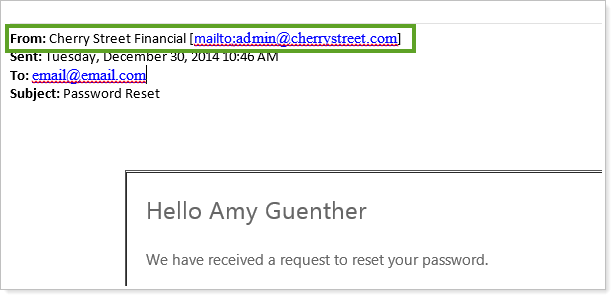
For details, and to enable this feature, please contact Account Management at TamaracAM@envestnet.com.
Permissions
Restrict Report Permissions to an advisor's Own Reports
We have given you more control over what advisors can access by adding a new delete permission for the PDF Report Status page. Previously, advisors were allowed to delete any report status. We have renamed this permission and it is now named Delete report status generated by any advisor. In addition, we have created a permission that limits advisors' delete permissions to only the report statuses they have created themselves. This new permission is named Delete report status generated only by advisor.
You can set these permissions on the User Management page when you manage roles.

To compliment these stricter permissions, we’ve also created a new permission for Global Document Access. When advisors have this permission, they can then either view the status for all reports, or just the reports they have generated. When advisors do not have this permission, they will only be able to view the PDF reports that they have generated from the Accounts page.

Third Party Integration
Real Time Prices for Holdings and Unrealized Gain/Loss Reports
Tamarac has partnered with Xignite to provide real-time pricing data in Advisor View on the Holdings and Unrealized Gains/Losses reports for U.S. equities and ETFs listed on U.S. stock exchanges, including NASDAQ, NYSE, NYSE Alternext, and over-the-counter exchanges. The prices are updated within 15 to 20 minutes.

Once you ask us to enable this feature, you can turn it on by selecting the Use real time pricing check box on the Holdings report and the Unrealized Gain/Loss dynamic report. The real time price will then update for the following columns:
| Holdings Report | Unrealized Gain/Loss Report |
|---|---|
| Value | Current Value |
| Unrealized Gain/Loss | Long-Term Gain/Loss |
| Unrealized Gain/Loss (Current Year) | Short-Term Gain/Loss |
| Percent Gain/Loss | Percent Gain/Loss |
| Percent Gain/Loss (Current Year) | Total Gain/Loss |
| Weight |
There is an annual fee to subscribe to real-time pricing, although if you have this feature for Advisor Rebalancing already, there will be no additional fee. For details, and to enable this feature, please contact Account Management at TamaracAM@envestnet.com.
Updated Services for Schwab Intelligent Integration
We’ve upgraded the services we use to provide access to Schwab Intelligent Integration to the latest version. This change does not affect the features you use today, but will allow us to deepen the integration in the future.
Usability
Internet Explorer 9 Discontinued 
In an effort to incorporate the latest features of modern Web browsers, we have discontinued support for Internet Explorer 9, as indicated in the last release.
important
Please take the time to upgrade to Internet Explorer 10 or 11 and ask your clients to do the same. We are committed to continually improving the products and services we offer, and we want our valued clients to get the most out of the new functionality we are developing.
If you are using Internet Explorer 9, you may find that your client portals and some areas of Advisor View no longer work properly. If you have any questions, please contact your Tamarac service team.
Updated User Area on Home Page
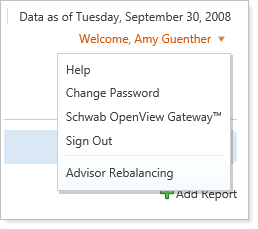
We’ve updated the user area so you can more easily manage your personal settings and integrations.
New Case Management Page on the Support & Training Center
To help you get the most out of your customer support hours, you can now more efficiently track your hours and submit service requests on the Support & Training Center. To check out this new feature, simply click Help and then click the Support Management tab.
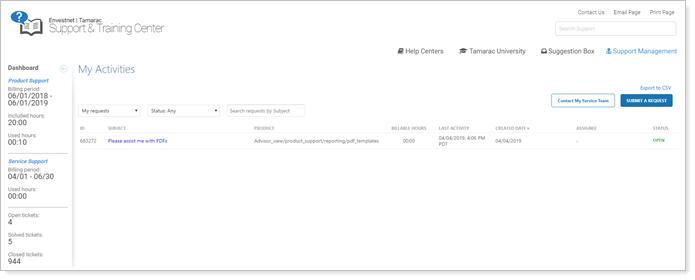
You’ll find the new page loads faster than before and provides many new features such as:
-
Email confirmations. You’ll receive an email when your service request is being worked on and you’ll be updated as information is added by members of our team. You can reply to these email messages to add information to the support request.
-
More Detailed Information. More clearly track your support hours in real-time.
-
Track your status. Quickly see which support requests are open, solved or awaiting your reply.
Security Maintenance
Customize Categories or Benchmarks for Account & Reporting Group Holdings
We added the option to rename any category or benchmark for any individual account or reporting group. Your changes will be shown only on that account or reporting group's reports. For example, Client A may want their reports to display ‘Equity,’ and Client B may want their reports to display ‘Stocks’ for the same category.
Once enabled, you can set this option on the new Category Overrides tab on the Edit Account and Edit Group windows, which show all active category types and categories within the enterprise.
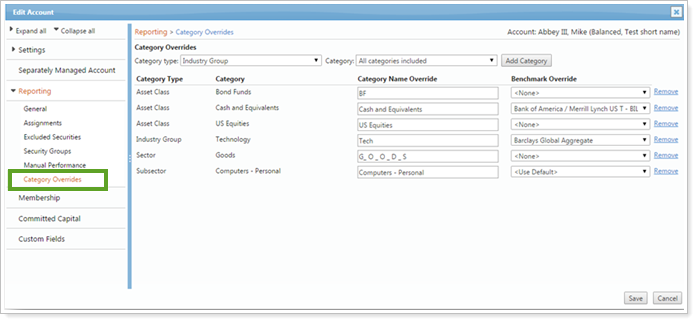
If you would like this option enabled, please contact your Tamarac service team.


