
Contents

Introduction
The Tax Impact Analysis report shows client or rebalancing group-specific tax data, based on the client's tax rates and lot-level holdings. A pre-rebalance analysis is based on the total unrealized gains and losses of the account. A post-rebalance analysis reflects the resulting tax implications for the specific trade recommendations.

Why Use This Report?
This report helps you consider the following:
-
Do the benefits of a rebalance outweigh the costs?
-
Should you wait to avoid short-term capital gains?
-
Do you have another source of funds with lower tax or no tax impact at all?
Report Sections
The Tax Impact Analysis report is comprised of several sections. The following is a summary of the information that can be found in each of these sections.
Summary
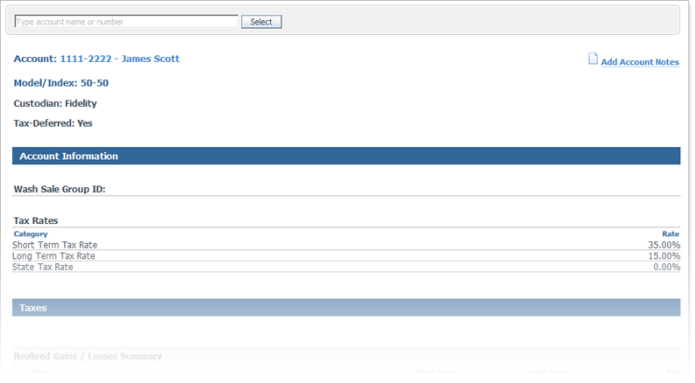
The first section outlines basic account information such as account number, name, assigned model, custodian and tax status. The Account Information section shows the Wash Sale Group ID, if any, and the tax rates for the account.
Taxes
The taxes sections show the tax impact based on several categories.
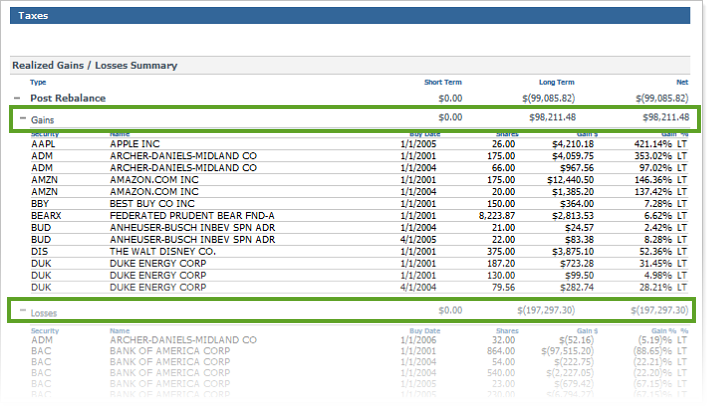
The Realized Gains / Losses Summary provides an in-depth analysis of tax consequences at the individual tax lot level. The realized gains and loss summary can be expanded to show each individual lot level gain or loss that a client would incur based on the trades Advisor Rebalancing recommends.
Each realized gain or loss displayed on the report shows when the lot was purchased, how many shares Advisor is recommending to sell, whether the gain or loss is short or long-term, and what the gain or loss is in both a dollar amount and percentage of the account.
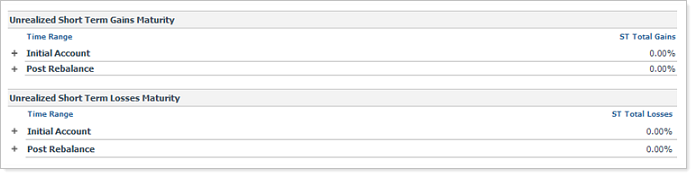
The Unrealized Short Term Gains Maturity and Unrealized Short Term Losses Maturity sections show unrealized short-term gains and losses by maturity date. This is displayed in periodic increments based on length of time before a position matures into a long-term gain or loss. Each lot lists buy date, shares, and gains or losses by dollar and percentage of the lot.
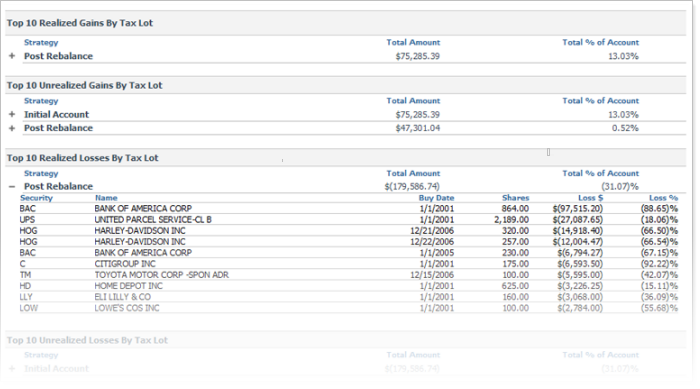
The final sections expand to show the top 10 realized and unrealized gains and losses by tax lot. These are the available sections:
-
Top 10 Realized Gains By Tax Lot
-
Top 10 Unrealized Gains By Tax Lot
-
Top 10 Realized Losses By Tax Lot
-
Top 10 Unrealized Losses By Tax Lot
The sections can be used to compare what the top unrealized gains and losses were pre-rebalance compared to post rebalance. Raising the tax sensitivity on the account causes the account to realize more losses and fewer gains. Each gain or loss displayed on the report shows when the lot was purchased, how many shares Advisor Rebalancing recommends selling, whether the gain or loss is long or short-term and the amount of the gain or loss.
Run the Tax Impact Analysis Report
To run the Tax Impact Analysis report, follow these steps:
-
On the Reports menu, click Tax Impact Analysis.
-
In the Search accounts box, start typing the name or number of the account where you want to run the report.
-
When you see the account in the list, click it and then click Select. The report appears on your screen.