Contents

Introduction
The Client Reports page allows you to create reports that you can give to clients. These reports are based on custom templates you create. After you create templates, you can then apply accounts and run these reports for clients.

Create a Report Template
You can easily build custom Rebalance Summary report templates to meet the unique needs of your firm. These reports can mirror the structure of the Rebalance Summary reports within Advisor Rebalancing or can be structured differently.
To create a report template, follow these steps:
-
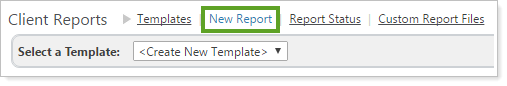
On the Reports menu, click Client Reports.
-
Click New Report.
-
Select Create New Template in the Select a Template list.
-
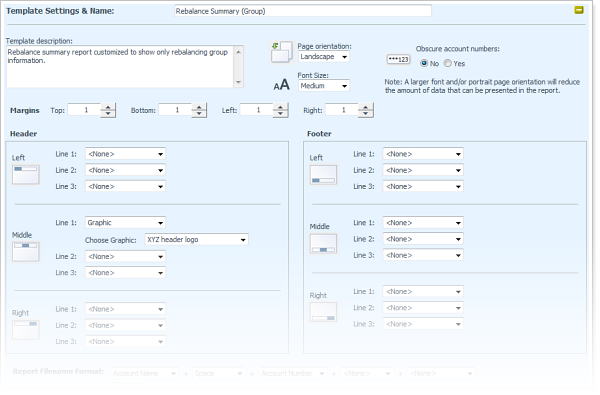
Define the fields under the Template Settings & Name section.
Note
This section, under Template Settings & Name, is used to define the default layout of the report. Each report section added to the template will have the option to Use Template Settings, which are the ones defined here, or to use custom header/footer settings for a given section.
Define each of these sections to your preference:
Setting More Information Template Settings & Name The title input here will be the report template name that will be used on the Select Template page.
Template Description Provide a brief description of this template. This will be presented on the Select Template page as the template description.
Page Orientation Select if you would like the report in a Landscape or Portrait view.
Obscure Account Numbers Select this option if you want only the last four digits of an account number shown on the report for privacy reasons.
Font Size Choose small, medium or large font size.
A larger font and/or portrait page orientation may reduce the amount of data that can be presented in the report. This is especially true for report sections that have tables with multiple columns of data selected.
Margins Set the top, bottom, left, and right margins for the report.
You can set margins from 0.01" to 1". You can specify margins to two decimal places, such as .25.
Header Select the custom data that you would like to appear in the left, middle, and/or right of the header.
You can choose up to three lines of information that display in a stack.
If you select a graphic to display in the header, that visual is the only element that can be displayed in that block. You cannot stack other header/footer options with the graphic element.
To add a custom graphic, you will need to first upload your graphic to Advisor Rebalancing. For more information, see Upload Custom Report Files.
Footer Select the custom data that you would like to appear in the left, middle, and/or right of the footer.
You can choose up to three lines of information that display in a stack.
If you select a graphic to display in the footer, that visual is the only element that can be displayed in that block. You cannot stack other header/footer options with the graphic element.
To add a custom graphic, you will need to first upload your graphic to Advisor Rebalancing. For more information, see Upload Custom Report Files.
Report Filename Format You can set the default file naming convention for generated reports, such as Account Name_Account Number.pdf.
The default name can still be modified during the save operation.
-
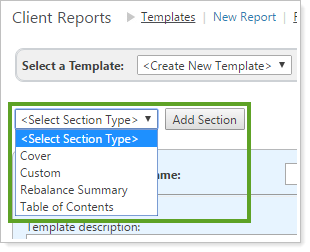
Add any sections you want to add to this template in the Select Section Type list and click Add Section. For more information on the available sections and their customization options, see Template Sections.
-
Click Save.
Template Sections
Within your report templates, you can add various sections. These sections allow you to add standardized sections to your client-facing reports.
Cover Section
The cover page can be customized with your firm’s branding and can have custom header/footer options that are different from the rest of the report.
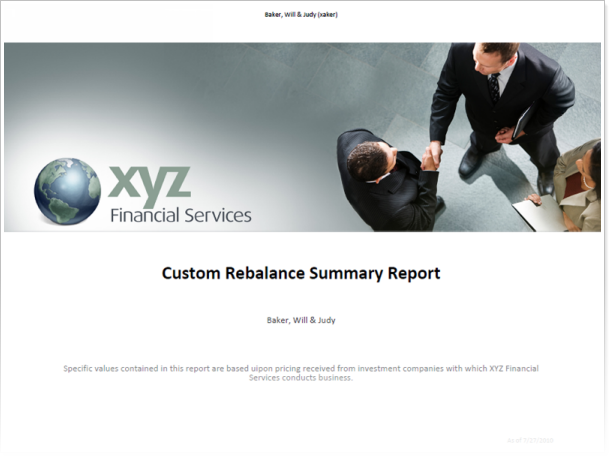
The content of the cover page consists of four data elements: Graphic, Title, Account Information, and Custom Text. Additionally, specific custom header and footer information can be used for the cover page.
Define each of these sections to your preference:
| Setting | More Information |
|---|---|
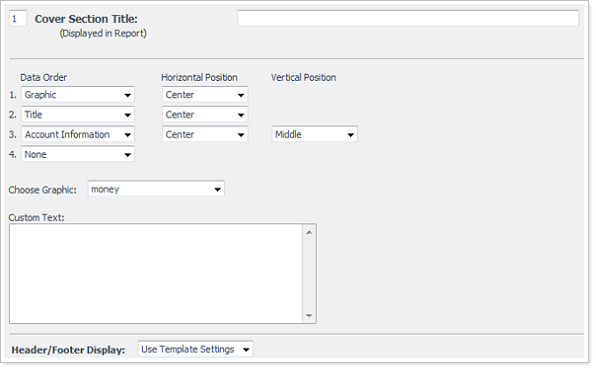
| Cover Section Title |
Use this field to enter the title of your report. This title will appear on the cover of the report and its position will be based on the Data Order and Horizontal Position selected for it. |
| Data Order |
Use the Data Order lists 1 through 4 to select the custom information and order of the information on the cover. The system will stack these selections and build in a 0.25” (or 75 pixel) padding between them. |
| Horizontal Position |
This gives you the ability to specify the horizontal position (Left, Center or Right) of each data element. |
| Vertical Position |
The vertical position is only relevant to the last data element selected. Since Advisor Rebalancing will stack each data element in the order selected (incorporating a 0.25” padding), the last data element will be positioned in the remaining area of the bottom of the page. The remaining space will vary depending on the size of the graphic used, the amount of copy in the title, etc. As such, you have the ability of selecting a vertical placement (Top, Middle or Bottom) to fine tune the placement of the last data element on the cover. |
| Choose Graphic |
If Graphic is selected as a data element under Data Order, the Choose Graphic list will appear active. Use this menu to select the desired image. Only those images uploaded from the Custom Report Files Upload page will be presented as options. |
| Custom Text |
If Custom Text is selected as a data element under Data Order, the Custom Text field will appear active. Us this field to input the copy you would like to be presented on the cover. |
| Header/Footer Display |
The Header/Footer Display options allow you to choose how your header and footer will appear. Choose Use Template Settings to use the header and footer options from the template or Custom to make a unique header and footer for the cover page. |
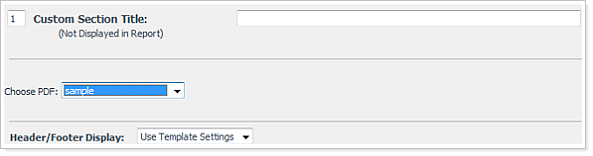
Custom Section
Use the custom section to add additional custom content for your clients, such as a personal letter or relevant article. Any content added in this section must be in PDF format and previously uploaded to Advisor Rebalancing using the Custom Report Files Upload page.
Define each of these sections to your preference:
| Setting | More Information |
|---|---|
| Custom Section Title |
This title will not appear in the report and is for template purposes only. |
| Choose PDF |
Use this list to select a pre-uploaded PDF file. |
| Header/Footer Display |
The Header/Footer Display options allow you to choose how your header and footer will appear. Choose Use Template Settings to use the header and footer options from the template or Custom to make a unique header and footer for the cover page. |
Rebalance Summary Section
The Rebalance Summary section shows details of a Rebalance Summary report in a client-facing format. You can add up to three different sub-sections and potentially display all the same information found in an online Rebalance Summary report.
Define each of these sections to your preference:
| Setting | More Information |
|---|---|
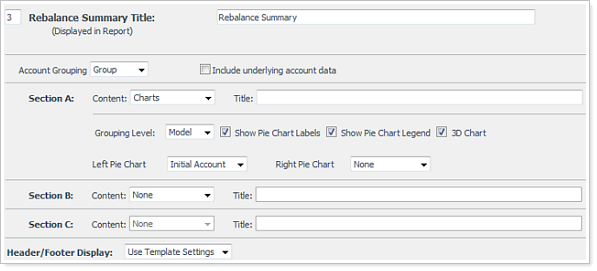
| Rebalance Summary Title |
Use this field to input the title of your report. This title will appear on the cover of the report and its position will be based on the Data Order and Horizontal Position selected for it. For more information, see Cover Section. |
| Account Grouping |
Use this drop-down list to determine how you want the accounts in the report to display, either as rebalancing groups, individual accounts, or both. |
| Include Underlying Account Data |
If selected, data about the individual accounts that make up the group will also display. |
| Sections A, B, and C |
In each of these sections, you can add one, two, or three subsections: Header, Charts, and Summary Details. To add, choose the option from the Content drop-down list. Each section can be a different subsection, or any combination, including three of the same subsections (for example, three Charts subsections). |
| Header/Footer Display |
The Header/Footer Display options allow you to choose how your header and footer will appear. Choose Use Template Settings to use the header and footer options from the template or Custom to make a unique header and footer for the cover page. |
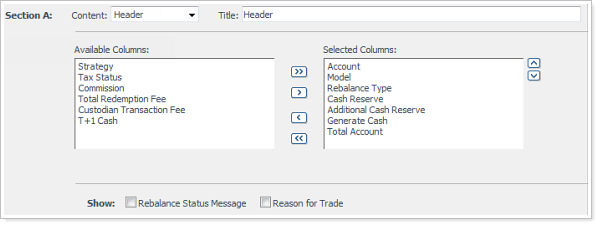
Header Subsection
The Header subsection allows you to add columns containing account data, like Account, Model, Total Account, and more.
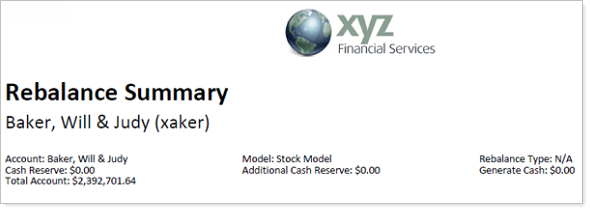
You can add customize the Header subsection by adding and removing columns. You can also customize the order of the columns shown.
Define each of these sections to your preference:
| Setting | More Information |
|---|---|
| Title |
Use this field to input the title of the Header subsection. |
| Available/Selected Columns |
The columns in the Selected Columns list will appear on the report. To add columns, use the right arrow to add a column to Selected Columns. To remove a column, use the left arrow to return the column back to Available Columns. Use the up and down arrows to order the columns in the Selected Columns list. |
| Show Rebalance Status Message |
Select this check box to display messages, such as success messages or warnings, in the Header. |
| Show Reason for Trade |
Select this check box to display the reason for trade in the Header. |
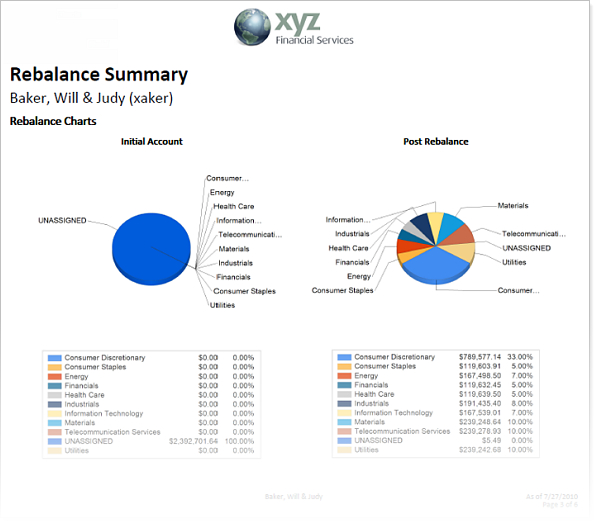
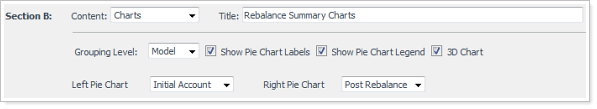
Charts Subsection
The Charts subsection allows you to show one or two pie charts, comparing data side-by-side. For example, you can compare Initial Account data to Post Rebalance data. You can also group the pie chart using one of several categories like model or sector.
You can add customize the Charts subsection by choosing from the available options.
Define each of these sections to your preference:
| Setting | More Information |
|---|---|
| Title |
Use this field to input the title of the Charts subsection. |
| Grouping Level |
Use this list to select the grouping for the pie charts on the report. Model is the default, but you can also select to group by other options, like Asset Class, Sector, and more. |
| Show Pie Chart Labels |
This check box is selected by default and displays the labels for the pie charts. Clear this check box if you do not want these labels to display. If you will have a large number of slices in a pie chart, consider not displaying the labels. |
| Show Pie Chart Legend |
This check box is selected by default, and displays the legend for the pie charts. Clear this check box if you do not want the legend to display. |
| 3D Chart |
This check box is selected by default, and displays the pie charts on the report in 3D. Clear this check box if you want the charts to display in 2D instead. |
| Left Pie Chart |
Use this list to select the pie chart that will display on the left in the Charts subsection. Initial Account is the default, but you can also select Post Rebalance and Target. |
| Right Pie Chart |
Use this list to select the pie chart that will display on the right in the Charts subsection. None is the default, but you can also select Initial Account, Post Rebalance, and Target. You should not select the same chart for both left and right pie chart options. |
Summary Details Subsection
The Summary Details subsection allows you to show rebalance information for the client. You can add rows to show details like Quantity ($) and Short Term Gain/Loss ($), in addition to the security and symbol information. You can also format how the rows are grouped and if you'd like to add colors to the report.
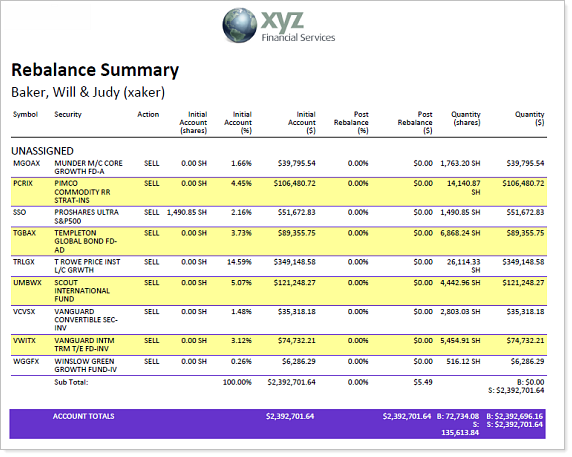
To customize this report, you can add and remove columns to show data about holdings in the account and the effect of a rebalance on those holdings, as well as formatting how these rows appear on the client-facing report.
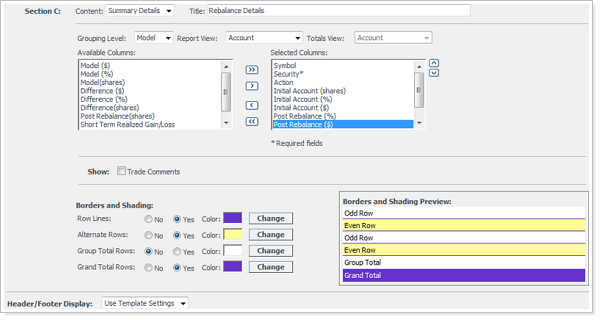
Define each of these sections to your preference:
| Setting | More Information |
|---|---|
| Title |
Use this field to input the title of the Summary Details subsection. |
| Grouping Level |
Use this list to select the grouping or the recommended trades on the report. Model is the default, but you can also select to group by other options, like Asset Class, Sector, and more. |
| Report View |
Use this list to select how you want data to display on the report, either for the Account or for Buys and Sells Only. |
| Totals View |
If you selected Account in the Report View list, the Account option is defaulted in this list and cannot be changed. If you selected Buys and Sells Only in the Report View list, you can then select to display as Account, Buys and Sells Only, or Both. |
| Available/Selected Columns |
The columns in the Selected Columns list will appear on the report. To add columns, use the right arrow to add a column to Selected Columns. To remove a column, use the left arrow to return the column back to Available Columns. Use the up and down arrows to order the columns in the Selected Columns list. You can select a maximum of 17 columns to display in the report. |
| Show Trade Comments |
Select this check box if you want the comments for each trade to display in the report. |
| Borders and Shading |
|

Table of Contents Section
This Table of Contents section adds a table of contents based on the sections you've added to report.
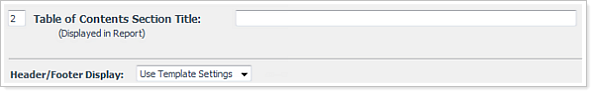
Define each of these sections to your preference:
| Setting | More Information |
|---|---|
| Table of Contents Section Title |
The title given to this section will be displayed at the top of the page. |
| Header/Footer Display |
The Header/Footer Display options allow you to choose how your header and footer will appear. Choose Use Template Settings to use the header and footer options from the template or Custom to make a unique header and footer for the cover page. |
Custom Report Files
You can upload image files to Advisor Rebalancing for the purpose of adding custom graphics or content to your performance reports. This is useful when creating a custom cover page, custom header/footer and adding custom pages of content, such as a relevant article or newsletter.
You can also upload PDF files to add to client-facing reports.
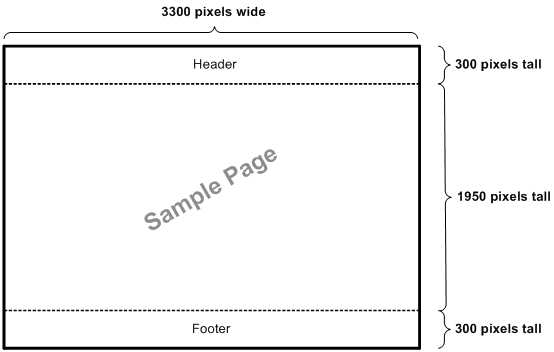
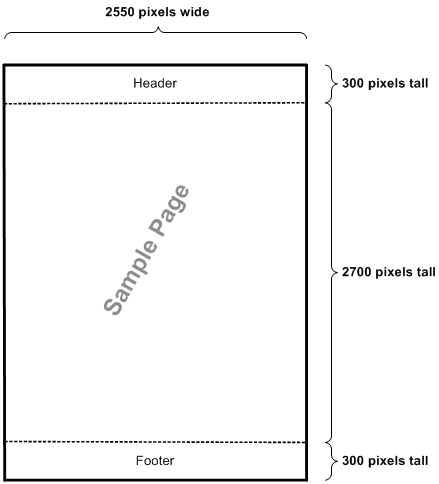
Dimensions
When creating custom graphics for either a cover page or a header/footer, keep the following dimensions in mind:
| Report section | More information |
|---|---|
|
Margins |
Advisor Rebalancing adds a 1 inch margin at the top and bottom of the page for a header and footer. You cannot remove or customize this margin. |
|
Header and footer |
The header/footer can accept an image that is 300 pixels tall, and:
|
|
Cover page |
The cover page can accept a custom image that is:
|
Upload Custom Report Files
To upload a custom report file, follow these steps:
-
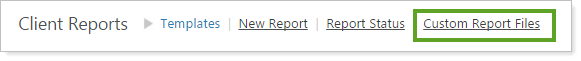
On the Reports menu, click Client Reports.
-
Click the Custom Report Files link.
-
In the Description box, type a description for the file—for example, Report Header.
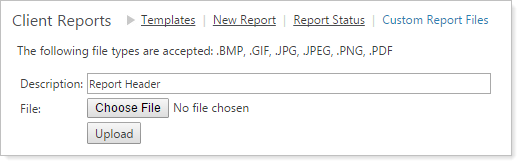
-
Click Choose File. Browse to and select the file that you want to upload, and then click Open.
Note
Advisor Rebalancing supports uploading these file types:
File Format Extension JPEG
.jpg and .jpeg
GIF
.gif
Bitmap
.bmp
Portable Network Graphics
.png
Portable Document Format
.pdf
-
Click Upload.
Run a Client Report
To run a client-facing report, follow these steps:
-
On the Reports menu, click Client Reports.
-
Select the report template that you would like to use by clicking on the associated option, and then click Next (Identify Accounts).
-
To view a specific set of accounts, use the Saved Search list.
-
Select the accounts where you want to run a client report by selecting the associated check boxes and then click the Generate Report button.
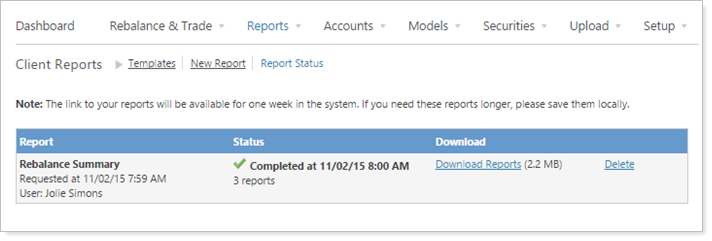
If you are running a client report on a single account or a rebalancing group, Advisor Rebalancing will present a popup window that gives you the option to download or view the report in PDF format. This report will not be stored by Advisor Rebalancing, and should be saved locally.
If you are running a client report on multiple accounts or rebalancing groups, you will be redirected to the Report Status page, where you can view the status of report creation.
-
When the reports have completed, click the Download Reports link in the Download column of the Report Status page.